- Getting Started
- Administration Guide
-
User Guide
- An Introduction to Wyn Enterprise
- Document Portal for End Users
- Data Governance and Modeling
- Working with Resources
- Working with Reports
- Working with Dashboards
- View and Manage Documents
- Understanding Wyn Analytical Expressions
- Section 508 Compliance
- Subscribe to RSS Feed for Wyn Builds Site
- Developer Guide
Group Data
Grouping is used to combine the rows based on certain values in one or more columns. If you group the data based on one column, all the rows with the same column values are grouped into one section. Adding groups to a table makes it easier to summarize and analyze the complex data in reports.
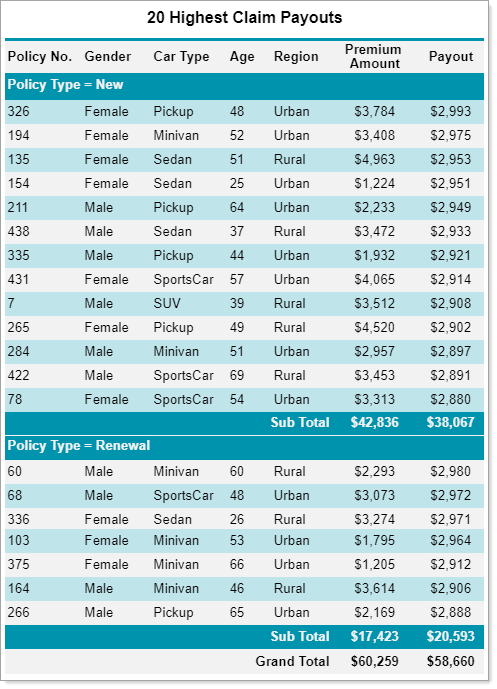
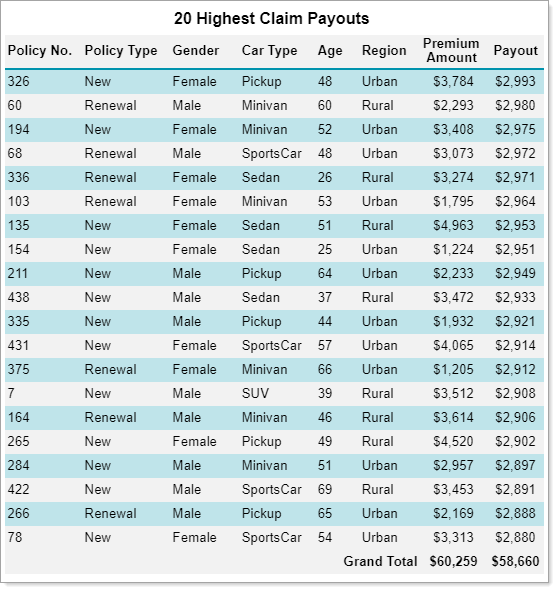
For example, the report shown below consists of a table displaying the 20 highest claim payouts.
However, you want to summarize the claim payouts based on the policy type in the report, that is, into New and Renewal. This will help you organize the data in the report and improve its understandability.
For more details, refer to the below section that explains the step-by-step process to add groups in a table.
To Add a Group to Table Data Region
Follow the below steps to add a group to a table.
Click anywhere inside the table to make the Groups pane appear on the right side of the table.
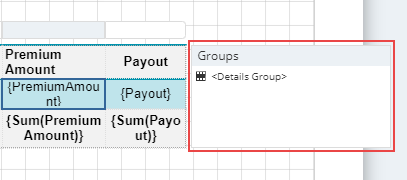
Drag and drop the desired field from the Data tab to the Groups pane. For example, use the PolicyType field to group the data based on the row based on the policy type values.
This adds a Group Header and Footer above and below the details row as shown, and sets the Grouping Expression property to in the Properties panel.
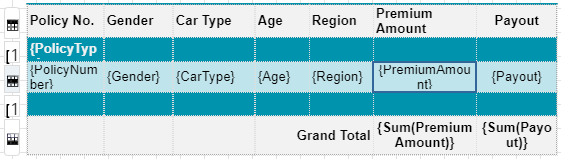
Note: Alternatively, you can add a group by selecting the Group > Insert Group option from the context menu. Also make sure to set the Grouping Expression property in the Properties panel to .
Merge the cells in the Group Header row by selecting the Cells > Merge Cells option from the context menu and enter the following expression in the Value property as PolicyType = .
For more information, see the Merge Cells article.
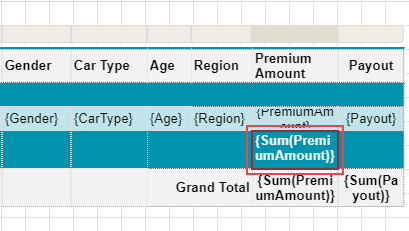
In the Group Footer row, select the cell falling in the Premium Amount column and enter the below expression in its Value property as {Sum(PremiumAmount)}.
This will add a summarized value for the premium amount at the end of each section.
Similarly, select the cell falling in the Payout column and enter the below expression in its Value property as {Sum(Payout)}.
This will add a summarized value for the payout at the end of each section.
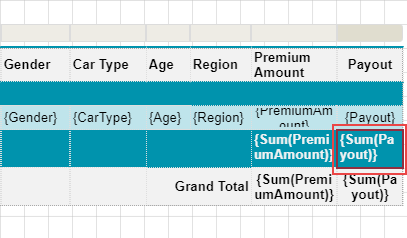
Additionally, you can enter the text, 'Sub Total', in the Group Footer cell of the Region column.
Preview the report.