- Getting Started
- Administration Guide
-
User Guide
- An Introduction to Wyn Enterprise
- Document Portal for End Users
- Data Governance and Modeling
- Working with Resources
- Working with Reports
- Working with Dashboards
- View and Manage Documents
- Understanding Wyn Analytical Expressions
- Section 508 Compliance
- Subscribe to RSS Feed for Wyn Builds Site
- Developer Guide
Filter Data
Use filters to view only the data in which you are interested. The filters make the data analysis easy and let you focus on the specific information.
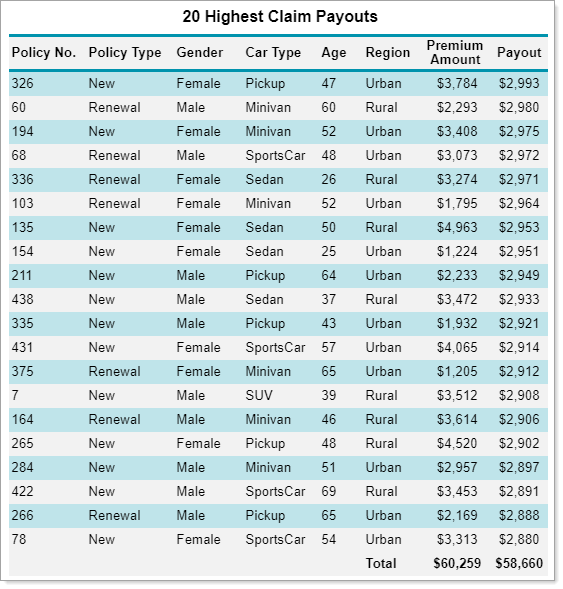
For example, you may want to filter the following data to display the claim payouts only for females aging between 40 to 60 years. The below sample report uses the InsuranceDataSource.
To Filter Data in a Table Data Region
Following are the steps to filter data in a table. Use the AND or OR operators to add multiple filters to a table.
Select the table by clicking the four-way arrow.
Note: If you want to apply a filter on a group, select the required group from the Groups pane.
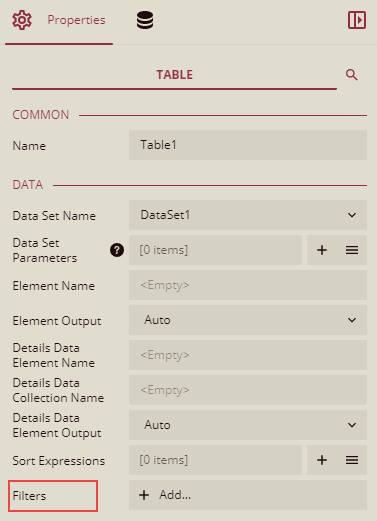
Go to the Properties panel and find the Filters property under the Data section.
Note: In case of applying a filter on a group, you can find the Filters property under the Group section.
Click the Add button to define the filter criteria for the table.
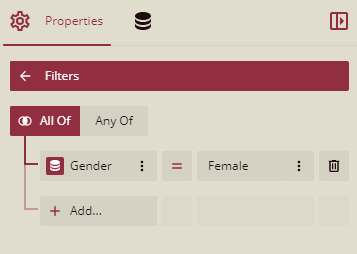
The first filter criteria will be applied to the Gender column. Therefore, click the Add button and select the Gender field from the dropdown.
Set the Operator to Equal To (=) and Value to Female. The filter criteria will look as shown below.
The second filter criteria will be applied on the Age column. So, again click the Add button and choose the Age field from the dropdown.
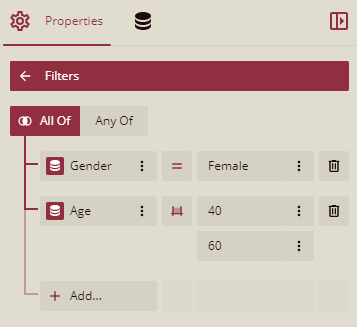
Set the Operator to Between, Value1 to 40, and Value2 to 60. The filter criteria will look as shown below.
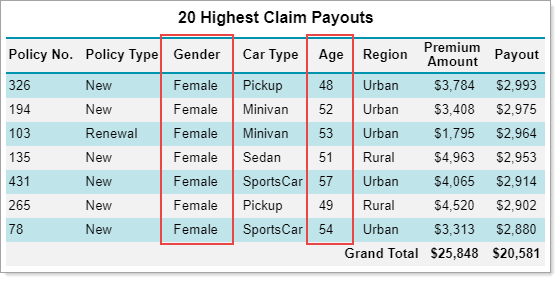
Preview the report to see the result.
The report now displays the records that match the specified conditions above, i.e, show claim payouts for only females with ages ranging from 40 to 60.