- Getting Started
- Administration Guide
-
User Guide
- An Introduction to Wyn Enterprise
- Document Portal for End Users
- Data Governance and Modeling
- Working with Resources
- Working with Reports
- Working with Dashboards
- View and Manage Documents
- Understanding Wyn Analytical Expressions
- Section 508 Compliance
- Subscribe to RSS Feed for Wyn Builds Site
- Developer Guide
Sparkline
In Wyn Enterprise, the Sparkline control is used to display data trends on a small graph in your reports. Sparkline shows the most recent value of the data at the rightmost point and compares it with an earlier value, allowing you to view general changes in the data over time.
Sparkline control supports line, column, profit and loss, area, and stacked charts. Sparkline control can be embedded within tables for better understanding and analysis of business data.
Structure
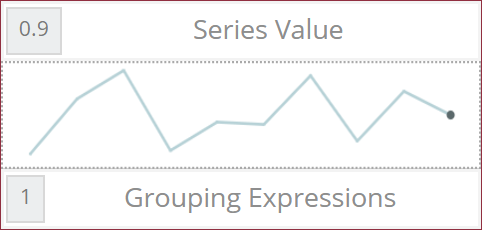
Series Value: A series value is used to show a set of data in the sparkline chart.
Grouping Expressions: Grouping expressions are used to group data in the sparkline.
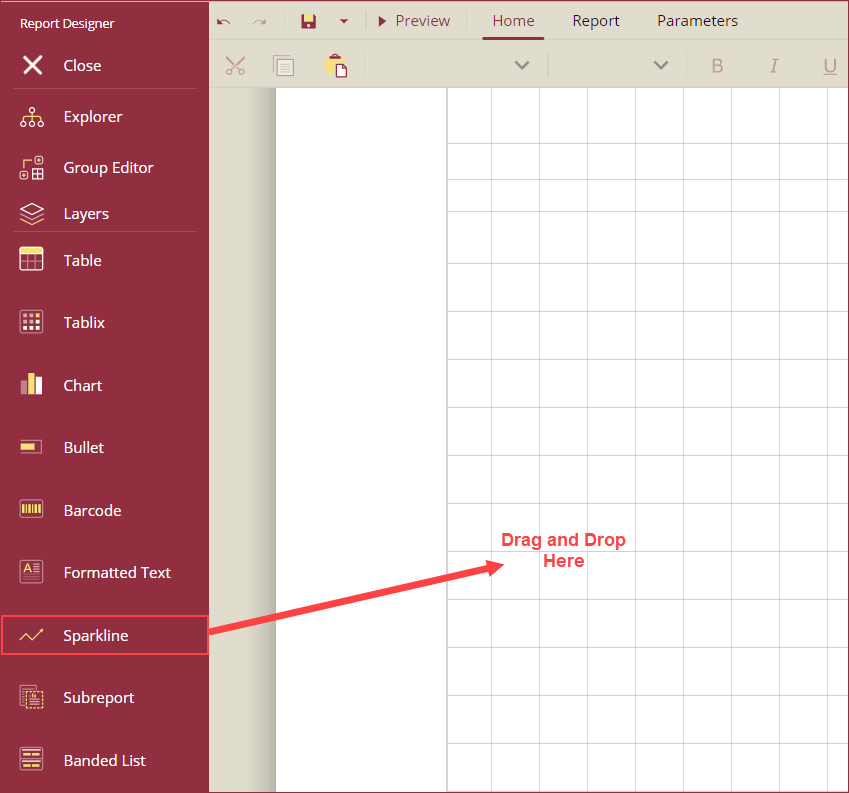
To add a Sparkline control to a report, navigate to the Report Designer and follow the below instructions:
Drag and drop the Sparkline control onto the design area from the Designer Toolbar.
Using the Inspector Panel on the right side of your screen, customize the appearance of the Sparkline control. See the Inspector Panel Properties section for more information on the properties of the Sparkline control.
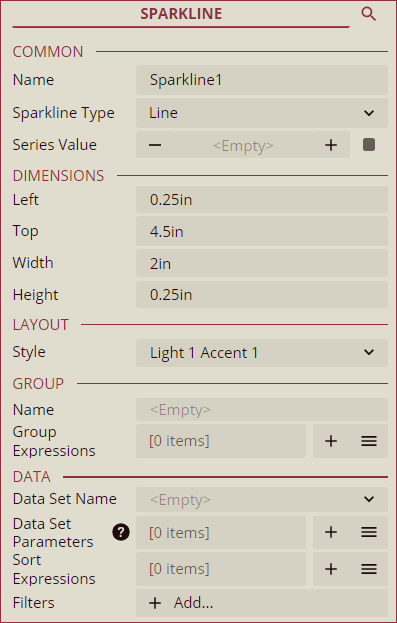
Inspector Panel Properties
Common
Property | Description |
|---|---|
Name | Add a unique name to the Sparkline control. Special characters such as period (.), space ( ), forward slash (/), backslash (\), exclamation marks (!), and hyphens (-) are not supported. You can use an underscore (_) in the name of the control. |
Sparkline Type | Select the chart type for the sparkline control. Use the dropdown to select one of the following options: Line, Columns, Whiskers, Area, or StackedBar. |
Series Value | Enter a value or an expression to use as a series value for the sparkline control. |
Dimensions
Property | Description |
|---|---|
Left | Set the left margin of the Sparkline control. |
Top | Set the top margin of the Sparkline control. |
Width | Set the width of the Sparkline control. |
Height | Set the height of the Sparkline control. |
Layout
Property | Description |
|---|---|
Style | Select a color theme for the Sparkline control from the dropdown. |
Group
Property | Description |
|---|---|
Name | Add a unique name to the details group. Special characters such as period (.), space, ( ), forward slash (/), backslash (\), exclamation marks (!), and hyphens (-) are not supported. You can use an underscore (_) in the name of the group. |
Group Expression | Add grouping expressions, such as field names, to the sparkline control using the + button. |
Data
Property | Description |
|---|---|
Data Set Name | Select a dataset from the dropdown to bind the data to the sparkline control. |
Data Set Parameters | Add parameters to the dataset using the + button. Dataset parameters can be values or expressions. |
Sort Expressions | Set a sort expression for the sparkline control using this property. See the Sort Data help article for more information. |
Filters | Add filters to filter out the data from the report. See the Filter Data help article for more information. |