- Getting Started
- Administration Guide
-
User Guide
- An Introduction to Wyn Enterprise
- Document Portal for End Users
- Data Governance and Modeling
- Working with Resources
- Working with Reports
- Working with Dashboards
- View and Manage Documents
- Understanding Wyn Analytical Expressions
- Section 508 Compliance
- Subscribe to RSS Feed for Wyn Builds Site
- Developer Guide
Bullet
In Wyn Enterprise, the Bullet control is used to compare a single value measure with the target value defined in the control properties. The Bullet control serves as an alternative to the dashboard gauges.
Using the Bullet control, you can define the worst value at the beginning and the best value at the end of the bullet graph. You can also define a qualitative range (bad, satisfactory, and good) on the bullet graph to view the position of the key measures within the range.
Structure
The structure of the Bullet control is described below:
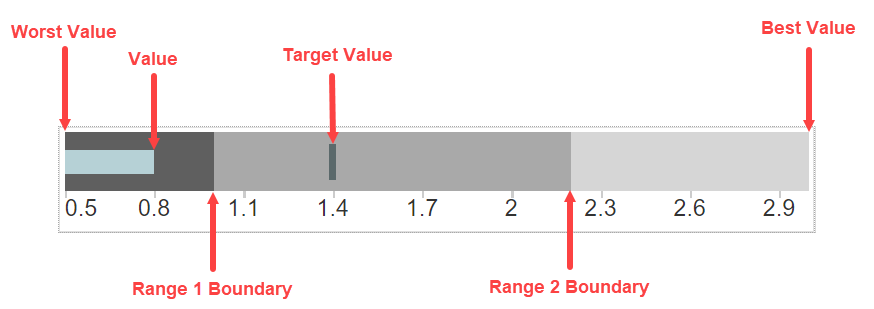
Value: Value is used to define the key measure on the graph.
Worst Value: Worst Value defines the least value on the bullet graph.
Best Value: Best Value defines the highest value on the bullet graph.
Target Value: Target value is used to visualize and compare a measure.
Range 1 Boundary: Range 1 Boundary defines the boundary between bad and satisfactory values.
Range 2 Boundary: Range 2 Boundary defines the boundary between satisfactory and good values.
To add a Bullet control to a report, navigate to the Report Designer and follow the below instructions:
Drag and drop the Bullet control onto the design area from the Designer Toolbar.
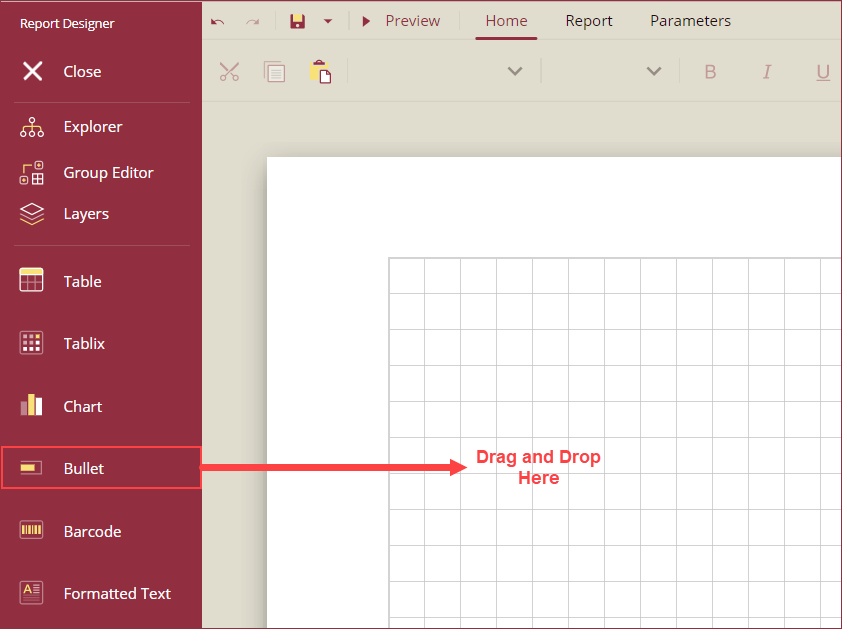
Using the Inspector Panel on the right side of your screen, customize the appearance of the Bullet control. See the Inspector Panel Properties section for more information on the properties of the Bullet control.
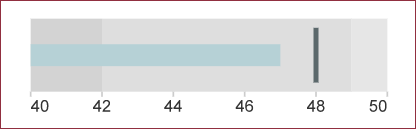
The below image shows an example scenario for a Bullet control with the following data,
Best Value: 50
Interval: 2
Range 1 Boundary: 42
Range 2 Boundary: 49
Target Value: 48
Value: 47
Worst Value: 40
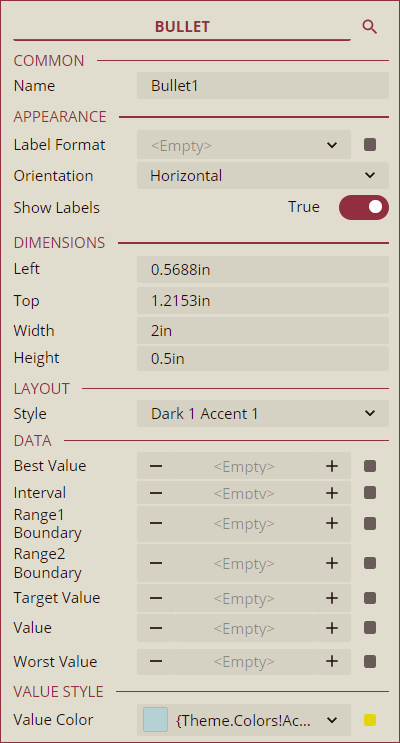
Inspector Panel Properties
Common
Property | Description |
|---|---|
Name | Add a unique name to the Bullet control. Special characters such as period (.), space ( ), forward slash (/), backslash (\), exclamation marks (!), and hyphens (-) are not supported. You can use an underscore (_) in the name of the control. |
Appearance
Property | Description |
|---|---|
Label Format | Select a format code to display the axis labels of the Bullet chart or create a custom format. The following Label Formats are available for the Bullet control in Wyn Enterprise, Currency, Decimal, Scientific, Fixed-point, General, Number, Percent, Hexadecimal, Short date, Long date, Full date/short time, General date/short time, General date/long time, Short time, Long time, Month day, Year month, and Custom. |
Orientation | Set the display orientation of the Bullet control from the dropdown to either Horizontal or Vertical. |
Show Labels | To turn off the label display, set the Show Labels flag to False. By default, the Show Label flag is set as True. |
Dimensions
Property | Description |
|---|---|
Left | Set the left margin of the Bullet control. |
Top | Set the top margin of the Bullet control. |
Width | Set the width of the Bullet control. |
Height | Set the height of the Bullet control. |
Layout
Property | Description |
|---|---|
Style | Select a color theme for the Bullet control from the dropdown. |
Data
Property | Description |
|---|---|
Best Value | Add a value or expression to set the highest value on the Bullet graph. Use the - and + buttons to adjust the values. |
Interval | Add a value or expression to set the data interval for the Bullet graph. Use the - and + buttons to adjust the values. |
Range1 Boundary | Add a value or expression to set the first reference interval for the Bullet graph. Use the - and + buttons to adjust the values. |
Range2 Boundary | Add a value or expression to set the second reference interval for the Bullet graph. Use the - and + buttons to adjust the values. |
Target Value | Add a value or expression to set the target value of the Bullet graph. Use the - and + buttons to adjust the values. |
Value | Add a value or expression to set the bullet value of the Bullet graph. Use the - and + buttons to adjust the values. |
Worst Value | Add a value or expression to set the least value of the Bullet graph. Use the - and + buttons to adjust the values. |
Value Style
Property | Description |
|---|---|
Value Color | Select a color from the dropdown or use an expression to define the color of the value marker. |