- Getting Started
- Administration Guide
-
User Guide
- An Introduction to Wyn Enterprise
- Document Portal for End Users
- Data Governance and Modeling
- Working with Resources
- Working with Reports
-
Working with Dashboards
- Dashboard Designer
- Selecting a Dataset
- Data Attributes
- Dashboard Scenarios
- Dashboard Templates
- Component Templates
- 3D Scene
- Explorer
- Visualization Wizard
- Data Analysis and Interactivity
- Dashboard Appearance
- Preview Dashboard
- Export Dashboard
- Dashboard Lite Viewer
- Using Dashboard Designer
- Animating Dashboard Components
- Document Binder
- Dashboard Insights
- Add a New Page in Dashboard Designer
- View and Manage Documents
- Understanding Wyn Analytical Expressions
- Section 508 Compliance
- Subscribe to RSS Feed for Wyn Builds Site
- Developer Guide
Modify Data Binding
You might want to modify the data binding for a scenario at runtime when previewing a dashboard in the Dashboard Viewer.
Modifying data binding involves binding the dashboard scenario with new attributes or replacing the existing bound attributes with new ones, and specifying their aggregation methods. You can perform the same operations on the data attributes that you could perform at design-time in the data binding area such as renaming, modifying data format, changing the display format, and many others. For more information about these operations, see Data Attributes. You can also change the scenario type to find the right view for the updated data.
Modify Data Binding
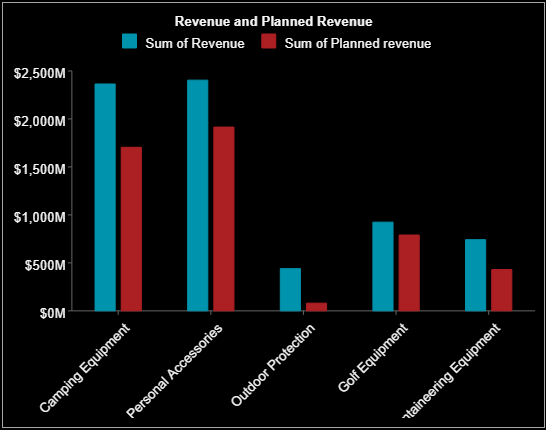
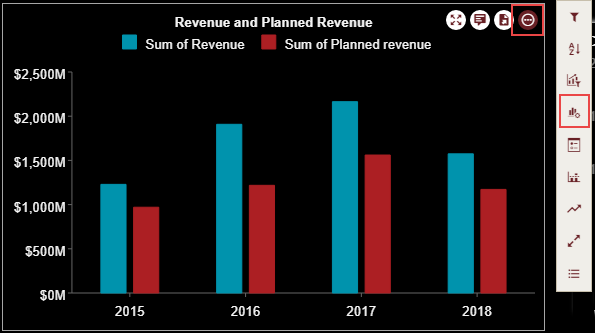
As an example, let's suppose you have a chart scenario that shows the revenue and planned revenue by year. Now you want to visualize the sales revenue by the 'Product Line' instead of 'Year'.
On the Dashboard Viewer, select the dashboard scenario for which you want to modify the data binding. Note that a More Actions button appears on the top right of the selected scenario.
Click More Actions to display the Action Bar and then select Data Binding.
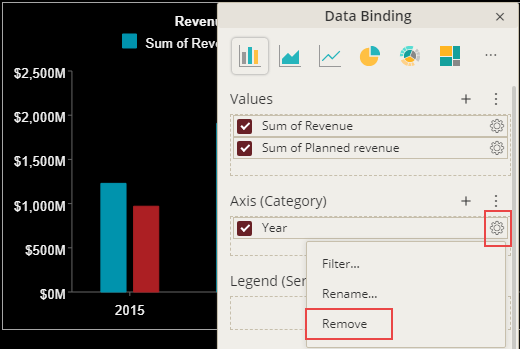
To change the bound attributes, go to the attribute's settings in the Data Binding dialog, and select Remove. For example, in our case, remove the bound attribute 'Year' next to Axis (Category).
Click the Add button next to the Axis (Category) and choose the data attribute from the list you want to visualize; in our case 'Product line'.
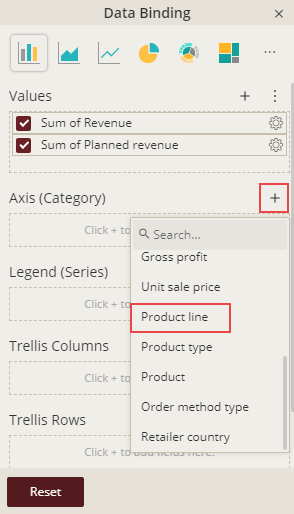
Click Reset to save the changes. The data represented in the scenario automatically changes when bound to new attribute(s).