- Getting Started
- Administration Guide
-
User Guide
- An Introduction to Wyn Enterprise
- Document Portal for End Users
- Data Governance and Modeling
- Working with Resources
- Working with Reports
-
Working with Dashboards
- Dashboard Designer
- Selecting a Dataset
- Data Attributes
- Dashboard Scenarios
- Dashboard Templates
- Component Templates
- 3D Scene
- Explorer
- Visualization Wizard
- Data Analysis and Interactivity
- Dashboard Appearance
- Preview Dashboard
- Export Dashboard
- Dashboard Lite Viewer
- Using Dashboard Designer
- Animating Dashboard Components
- Document Binder
- Dashboard Insights
- Add a New Page in Dashboard Designer
- View and Manage Documents
- Understanding Wyn Analytical Expressions
- Section 508 Compliance
- Subscribe to RSS Feed for Wyn Builds Site
- Developer Guide
Preview Dashboard
Wyn Enterprise has an in-built Dashboard Viewer that allows you to preview the dashboard any time you want. The Dashboard Viewer also provides you with a variety of additional features that can help you analyze your data more effectively.
The Dashboard Viewer can be Standard or Lite, which is controlled in the Dashboards Settings in the Admin Portal. You can also control this setting in the Dashboard Designer in the Inspector panel as described in this article - Switch to Lite Viewer. This panel is displayed on the right and contains the Default Viewer property under the General settings.
To Preview a Dashboard
In the Document or Resource Portal of the Wyn Enterprise application, select the dashboard you want to preview.
Hover on the dashboard and click on the name of the dashboard.
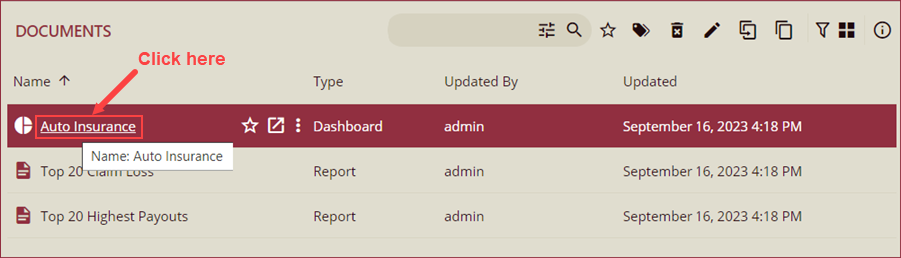
The dashboard preview is displayed.
You can also click this icon  , to view the dashboard in another window.
If you want to reload the dashboard or preview the dashboard in a new window, use the Reload or New Window options in the Dashboard Viewer, respectively.
Additional Features
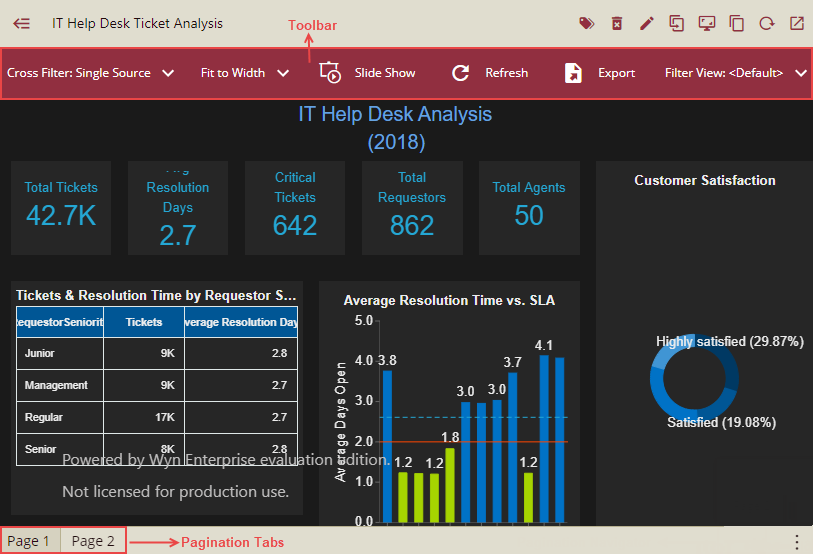
Dashboard preview has the following additional features: Toolbar, Pagination Tabs and Pagination Navigator
Toolbar
You can access these features from the toolbar available on top of the Dashboard Viewer.
Cross Filter (Single Source, Multi-Source, Off)
The Cross Filter feature provides the capability to focus on relevant information across the scenarios in a dashboard.
The Single Source cross-filtering allows the data to filter across other scenarios based on the data attribute selected for the single scenario. As the selection is changed, the new filter is applied without retaining the previous filter. The single source cross-filtering is very useful for simple analysis.
The Multi-Source cross-filtering allows the data to be filtered across all dashboards based on selections across multiple scenarios. That is, the filter is applied based on data attributes selected across multiple scenarios.
Consider a scenario where you are analyzing the Average Revenue by Retailer Country, Product Line, and Product Type. You want to filter data such that the average revenue for only two countries - the United States and Canada are displayed based on the two product lines - Camping Equipment and Outdoor Protection.
In this case, multi-source cross-filtering can be applied as shown. Note that the filters over previous selections are retained.
Fit to Screen (Fit to Width, Fit to Height, Auto)
Adjust the dashboard display to fit the screen, width, or height. The default can be specified from the Page Size property of the dashboard.
Slide Show
To create a slideshow of the dashboard pages.
Refresh
To refresh the dashboard for any modifications or updates.
Export
Select Export on top of the page if you would like to export the complete dashboard document.
Export Formats - Select export format - export as a PNG Image or export as a PPT.
Pages – Select what pages to export - Current Page, Visible Pages, All Pages, Custom Pages.
Export to (for PNG Image) – Select how to export the dashboard - as Single Image or Separated Pages.
Filter View
Set the filtered state of the dashboard.
Reset to default view - Set the filter view state to the original view.
Save current view - Save the current filter state of the dashboard. Provide a name in the Save Filter View pop-up dialog (should be a unique filter view name) and select it from the dropdown list to switch the state.
Manage views - Edit or delete the added filter views from the Manage Views pop-up dialog.
Note: The filter state is saved for the current dashboard, current user, and on the current browser.
Page Settings
In case of multiple pages in a dashboard, you can apply different page settings based on the requirement and set whether to display these settings or not at preview like: display style, display position, etc. Default Page Settings are as shown below:
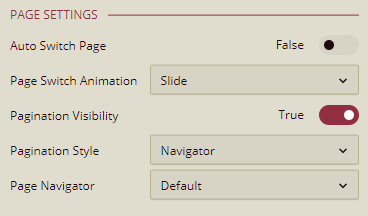
Listed below are all the page settings.
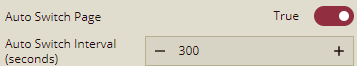
Auto Switch: By default, you need to manually switch the pages while previewing a dashboard. To enable the automatic page switching function, you can set the Auto Switch property to True. The dashboard pages will switch automatically from one page to another in this scenario.
Auto Switch Interval (Seconds): This setting is enabled only when the Auto Switch property is set to True. You can set the switch interval (in seconds). The page will switch automatically according to the specified interval.
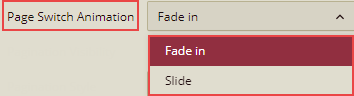
Page Switch Animation: Use this property to set the animation and transition property to be applied while switching the page in the dashboard preview. It has two options: Fade in and Slide.
Pagination Visibility: Pagination helps to navigate through different pages of a dashboard. So, you can set the Pagination Visibility property to True to view the pagination labels else you can set it to False.
Pagination Style: This property is enabled only when the Pagination Visibility is set to True. This has two options: Tabs and Navigator.
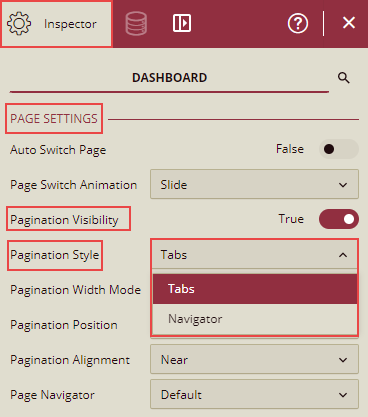
Tabs:You can use pagination tabs to add the scenarios on different pages. So, to display these pagination tabs on preview, select the option Tabs from the dropdown list. On preview, you can see the pagination tabs and you can click these tabs to navigate from one dashboard page to another as shown below.
When Pagination Style is selected as Tabs, then three more properties are enabled to set the position, width, and alignment of these tabs.
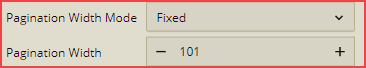
Pagination Width Mode: Sets the width of the pagination tabs. The dropdown list has three options: Auto, Fixed, and Distribute. Auto is the default setting. Fixed means you can specify the width of the pagination tabs in another field Pagination Width.
Distribute means that the width of the pagination tabs will be distributed equally.
Pagination Position: This property sets the display position of the pagination tabs in the dashboard. It has four options: Top, Bottom, Left, and Right.
Pagination Alignment: This sets the alignment of the tabs on the selected position. It has three options: Near, Far, and Center.
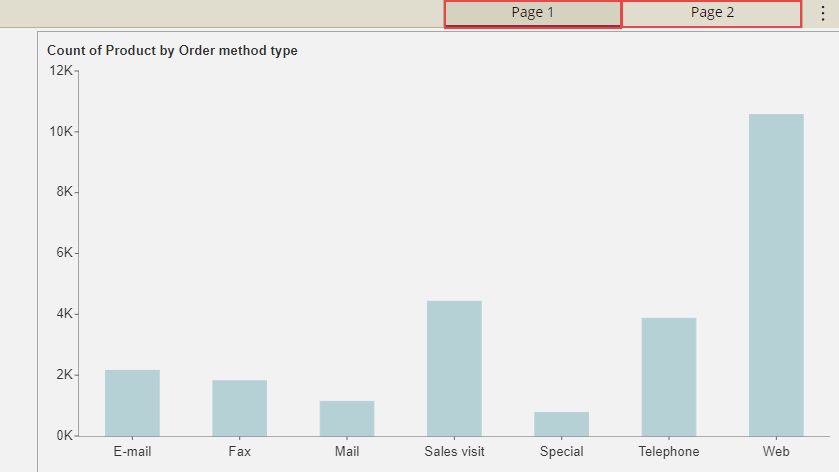
Below is an example with Pagination Style selected as Tabs.
Pagination Width Mode is Fixed.
Pagination Position is Top.
Pagination Alignment is Far.
The preview will be as shown below:
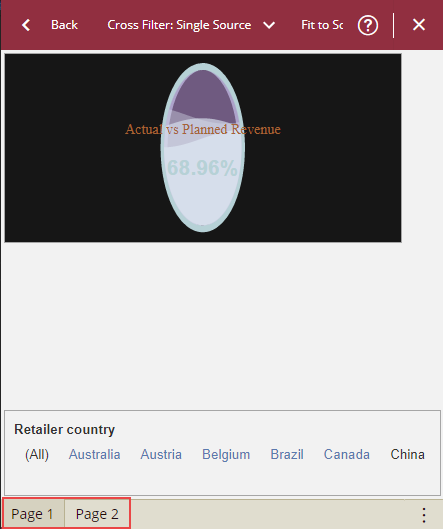
Navigator: If you do not want to display the pagination tabs on the preview, then select the option Navigator.
You will be able to see the pagination navigator at the bottom.
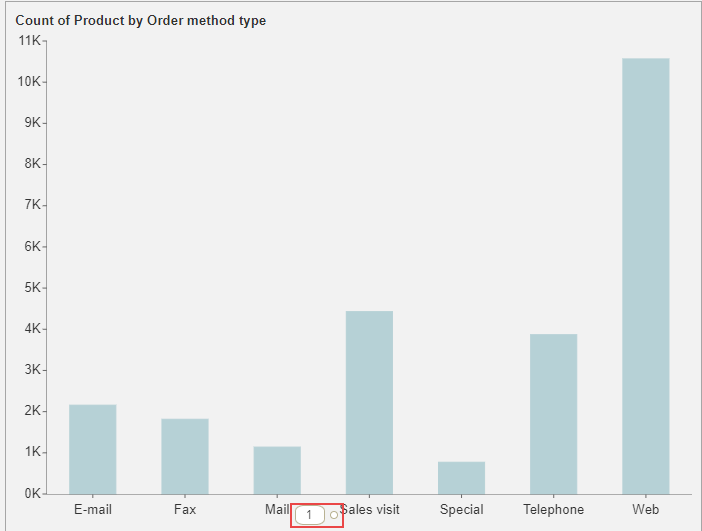
You can click these pagination navigators to navigate from one page to another in the dashboard.
Page Navigator: When Pagination Visibility is set to False, then you can set the Page Navigator to Default to navigate from one page to another using an arrow toggle button on the right and left side.
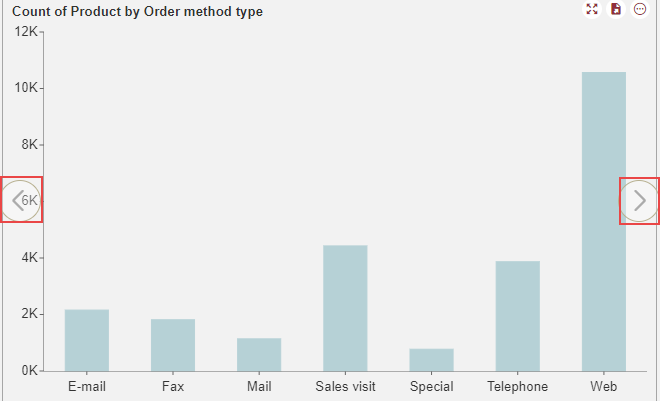
You can click the page navigators on the right and left side to navigate to different pages.
To hide the Page Navigator on the preview, select Page Navigator as Hidden.
When Pagination Visibility is set to False and Page Navigator is also selected as Hidden, then you can use the Auto Switch property to navigate from one page to another.
Note: Toolbar is not visible in the Lite Viewer.
When you hover on any dashboard scenario in the Viewer, you can switch to the Focus mode, Export the scenario, and apply Actions as described below.
Focus
Lets you focus attention on an individual dashboard scenario in the viewer. Click Back to Designer
 to go back to the preview mode. Click Show/Hide Data
  to show or hide the data bound to the scenario.
Note: Card chart scenario does not support the Focus option.
Export
Allows you to export the dashboard scenario as a PNG/SVG image or export the data of a dashboard scenario.
More Actions
Use Action Bar to filter and sort data, specify conditional visualization settings, add reference line, bind data, etc. For more information on these operations, see the topic Data Analysis and Interactivity in Dashboards.