- Getting Started
- Administration Guide
-
User Guide
- An Introduction to Wyn Enterprise
- Document Portal for End Users
- Data Governance and Modeling
- Working with Resources
- Working with Reports
- Working with Dashboards
- View and Manage Documents
- Understanding Wyn Analytical Expressions
- Section 508 Compliance
- Subscribe to RSS Feed for Wyn Builds Site
- Developer Guide
Wyn Enterprise: Tablix
The Tablix data region displays the data in a cross-table format, which is especially useful in analyzing a huge set of categorical data. It also provides an efficient way to create a multidimensional report organized in meaningful hierarchies based on the business requirements.
A tablix is a combination of two report regions, a table and a matrix. Therefore, it combines the functionalities of both the data regions (table and matrix) with added capabilities including the support for adjacent groups, interactive layout options such as the stepped row group, collapsed group, and more. By default, a tablix consists of four cells, where each cell contains a Textbox control.
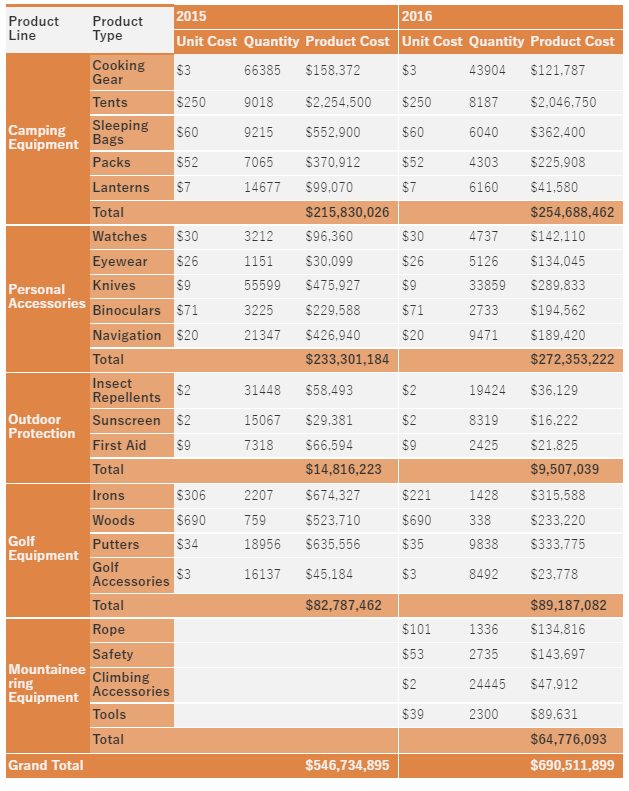
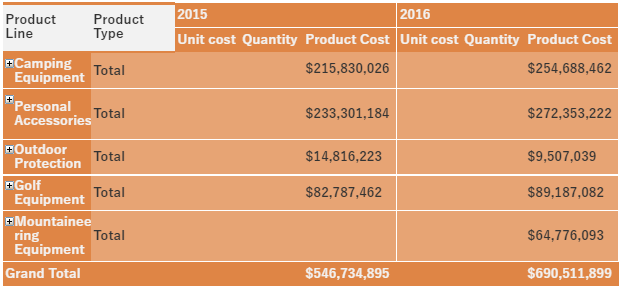
The following figure shows a Tablix data region displaying the yearly product sales.
Tablix Components
Typically, a tablix is composed of the following components -
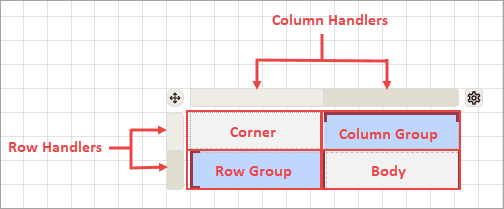
Corner - Displays static information such as headings, titles, etc. representing the tablix data.
Row Group - Groups in this area organize the report data in horizontal direction. A row group is represented by a square bracket on the left side of the row.
Column Group - Groups in this area organize the report data in vertical direction. A column group is represented by a square bracket above the column.
Body - Displays aggregated data by the row and column grouped data in the Tablix data region.
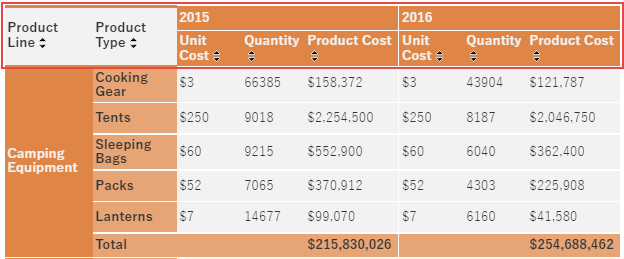
Static and Dynamic Rows and Columns
A row and column in a Tablix data region can either be static or dynamic.
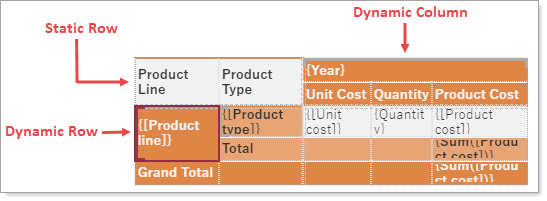
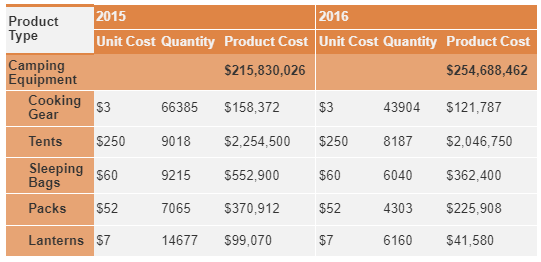
Static Rows and Columns - Static rows and columns are used to display labels and totals. They are rendered only once when you preview a report. For example, the header and footer rows in a tablix are static rows.
Dynamic Rows and Columns - Dynamic rows and columns are associated with one or more groups. They are rendered once for every unique value in the group when you preview a report and are known as group instances.
The following figure shows a tablix data region with static and dynamic rows and columns.
Tablix Wizard
The Tablix Wizard is broadly divided into two portions. The portion on the left displays the available fields in the bound dataset. The portion on the right displays the design area that allows you to configure the row groups, column groups, values, and layout options.
The Configure button on the top-right corner of the tablix displays the Tablix Wizard.
Layout Design - It provides various layout options for the row and column groups in a tablix. You can also use the Filter button
 to filter the data in a tablix.
The Totals tab describes the layout settings related to the totals and subtotals for the row and column groups.
Totals for Row Groups - A new row is added to display the aggregated values at the end or beginning of the parent row group.
Subtotals for Row Groups - A new row is added to display the aggregated values at the end or beginning of the child row group. This option is applicable when a tablix consists of a row group hierarchy.
Totals for Column Groups - A new column is added to display the aggregated values at the end or beginning of the parent column group.
Subtotals for Column Groups - A new column is added to display the aggregated values at the end or beginning of the child column group. This option is only applicable when a tablix contains a column group hierarchy.
Show Totals before Groups - Choose whether to display the totals and subtotals before or after row and column groups.
The Styling tab lists the available styles that you can apply to the tablix, such as Light Style 1 Accent 1 Tablix, Light Style 1 Accent 2 Tablix, Light Style 1 Accent 3 Tablix, No Style No Grid Tablix, SmoothTablix, and more. The styling options depend on the current report theme.
The Organization tab provides interactive layout options for tablix.
Expand/Collapse Groups - Expands and collapses the rows and columns in a group hierarchy.
Collapsed Group - Hides the rows and columns associated with child row and column groups. This option is available when you check the Expand/Collapse Groups option.
User Sort - Adds interactive sort buttons to the column headers that help to organize the tablix data.
Stepped Rows Groups - Displays all the child row groups in the same column as the parent group. By default, the row groups in tablix are displayed in different columns.
Frozen Rows and Columns - Locks certain rows and columns to keep them visible while the rest of the tablix scrolls.
Row Groups - Arranges the data in groups by rows. The row groups expand vertically in a report. You can apply filter on the row group, specify the sorting order for the row group, modify the data format, and swap the rows/column groups.
Column Groups - Arranges the data in groups by columns. The column groups expand horizontally in a report. You can apply filter on the column group, specify the sorting order for the row group and modify the data format.
Values - Refers to the summary values to be displayed in the tablix cells. You can specify the aggregate function for the field, modify the data format, or apply summary and total value calculations (such as % grand total, % row group total, etc.). For more information on summary and total value calculations, see the Expression Editor article.
By default, the summary values are arranged horizontally. You can use the Show Values as Rows/Columns to arrange the data vertically.
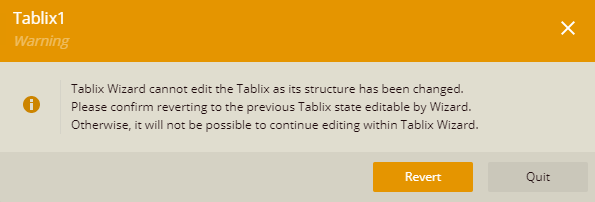
Note: The Tablix Wizard displays a warning message if the structure of the tablix gets complicated due to the modifications in the tablix structure.
Bind Data to a Tablix Data Region
Follow the below steps to bind data to a Tablix data region.
From the Report Toolbox on the left, drag and drop the Tablix data region onto the design area (or simply click the report item).
If a dataset is already added to the report, a Tablix Wizard appears after dropping (or clicking) the data region. The Tablix Wizard allows you to quickly configure the tablix data and layout.
Drag and drop the dataset fields from the left panel into the Row Groups, Column Groups, and Values areas on the right. A tablix with defined row and column groups is created as shown.
For more information, see the Tablix Wizard section.
If you close the Tablix Wizard, a blank matrix with two rows and columns is created. You can use the context menu to manually add the row and column groups and the Group Editor to view the row and column group hierarchies.
See the Add Row and Column Groups article.