- Getting Started
- Administration Guide
-
User Guide
- An Introduction to Wyn Enterprise
- Document Portal for End Users
- Data Governance and Modeling
- Working with Resources
- Working with Reports
-
Working with Dashboards
- Dashboard Designer
- Selecting a Dataset
- Data Attributes
- Dashboard Scenarios
- Dashboard Templates
- Component Templates
- 3D Scene
- Explorer
- Visualization Wizard
- Data Analysis and Interactivity
- Dashboard Appearance
- Preview Dashboard
- Export Dashboard
- Dashboard Lite Viewer
- Using Dashboard Designer
- Animating Dashboard Components
- Document Binder
- Dashboard Insights
- View and Manage Documents
- Understanding Wyn Analytical Expressions
- Section 508 Compliance
- Subscribe to RSS Feed for Wyn Builds Site
- Developer Guide
Slicers
Slicers are visual filters that dynamically filter the data at run-time and make the dashboard more effective and interactive. The scope of influence that slicers have on the dashboard includes the scenarios that are on the same page and on different pages of the dashboard as well, that use the same dataset. It allows the users to use the slicers with multiple-page dashboards.
The following table explains the different types of built-in slicers available in Wyn Enterprise. You can also create a custom slicer based on your business requirements.
Slicer | Description |
|---|---|
Label Slicer | It allows you to apply a filter to a data attribute in the dataset. |
Multi-dimensional Slicer | It enables you to add a filter to multiple data attributes in a single slicer. The chosen data attributes are displayed in a hierarchical order within a list. You can build a hierarchy tree using the following options in the Data Binding Panel - Multi-Dimensions, Parent-Child, and Hierarchy. |
Multi-dimensional Dropdown Slicer | It enables you to add a filter to multiple data attributes in a single slicer. The chosen data attributes are displayed in a hierarchical order within a dropdown. You can build a hierarchy tree using the following options in the Data Binding Panel - Multi-Dimensions, Parent-Child, and Hierarchy. |
Data Range Slicer | It allows you to apply a filter to any measure in the dataset and displays the data that meets the specified value range. |
Date Range Slicer | It allows you to apply a time-based filter to any date attribute in the dataset or model with various granularities of 'year', 'year-quarter', 'year-month', 'date', and 'date-time'. It also provides support for different precision filters, which are controlled through the Display Mode property of the slicer. Date and date range are the two types of display modes. In date display mode, you can filter the data based on a single-valued date. While in date range display mode, you can filter the data based on multi-valued dates, such as start time and end time. There are two more properties Allow Switch Display Mode and Allow Switch Display Mode. For details refer Switch Date Mode and Display Mode. You can also set a default value(s) for the slicer in both modes. For details about setting the default values, refer to the section Set Relative Date. |
Relative Date Slicer | It allows you to apply a filter to the dashboard data depending on a relative date and the chosen date attribute. For details about setting the default values, refer to the section Set Relative Date. |
Composite Slicer
| It allows you to freely add filter conditions while previewing the dashboard. For details, refer to the section Composite Slicer |

Add a Slicer
From the Slicers node, drag-drop the Label Slicer on the design area.
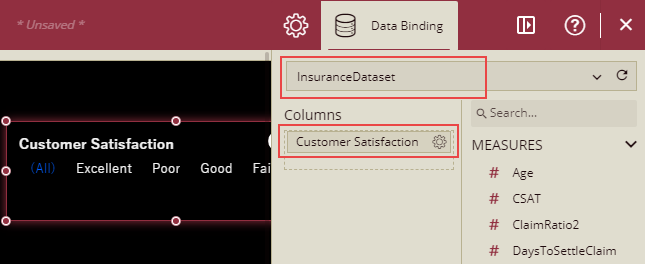
On the Data Binding area, choose an appropriate dataset and then select an attribute for the Columns field. For example, in the following image, we selected the 'Customer Satisfaction' attribute.
Or,
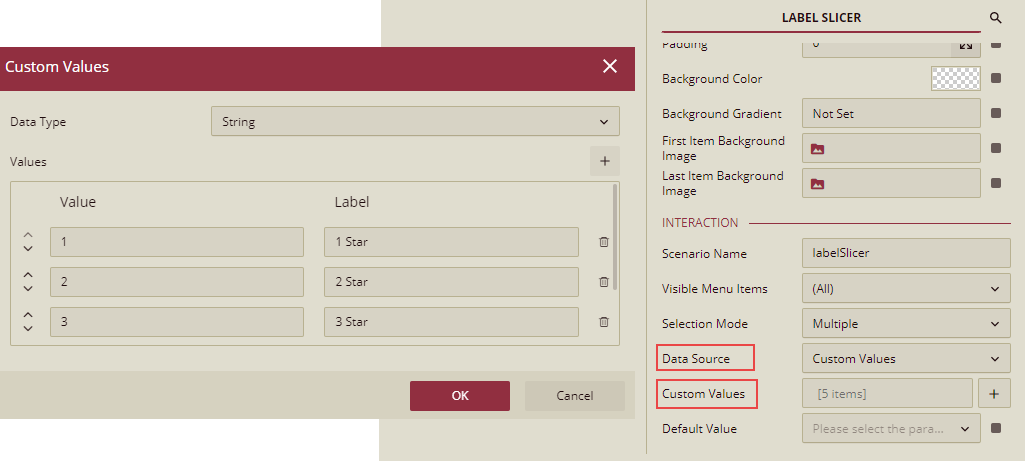
To bind the slicer to custom data, set the Data Source property in the Inspector panel to Custom Values, and then add customized values based on your needs. By, default, this property is set to From Query.
Select any data attribute for the Columns field. For example, in the following image, we selected the 'Customer Satisfaction' attribute.
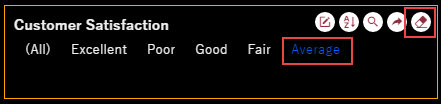
Click the Edit button in the upper-right corner of the slicer. You will get the following options: select parameter, no sort, search, and share scenario.
If you choose any data value in the edit mode of the slicer, the value is set as its default value. To clear the selected value and restore the slicer to its initial state, use the Clear Selection editing option which is now available. In the following image, we selected 'Average' as the default value for the slicer.
Apply filter or sort operation on the data values using the Action Bar corresponding to the selected slicer. For example, the data values for the 'Customer Satisfaction' field are manually sorted in the below slicer.
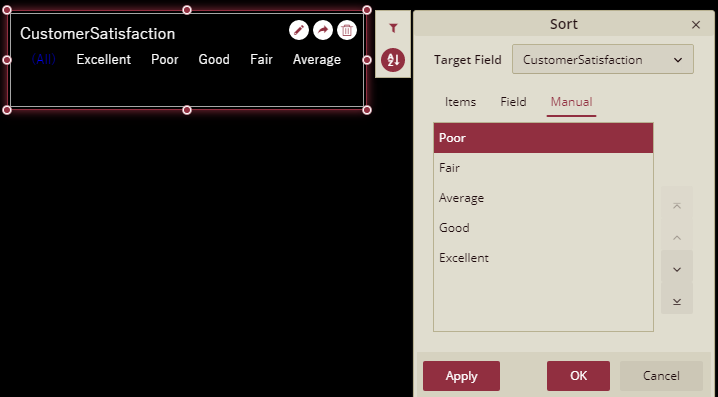
Note: Slicers like data range, date range, and relative date do not support the filter and sort operations on their data values.
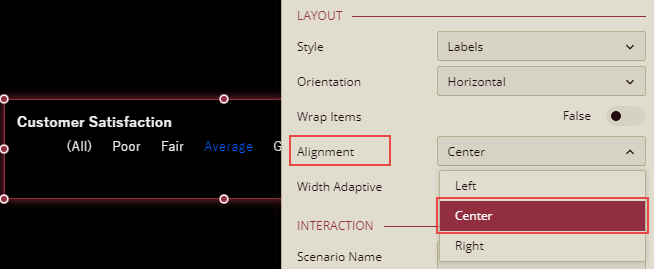
In the Inspector tab of the slicer, you can define various properties related to its layout, interaction, data, title, and so on. For example, if you want to set or modify the text alignment in the slicer, use the Alignment property as shown.
Preview the dashboard.
In the following dashboard, data is filtered based on the 'Customer Satisfaction' values selected in the slicer.
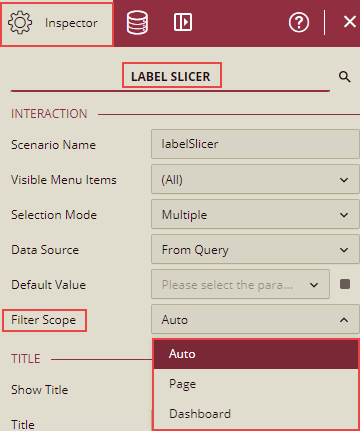
Slicer Filter Scope
This section explains the scope of influence that slicers have on the dashboard scenarios based on the filters. You can find Slicer Filter Scope on the Inspector tab.
Following table explains the different types of Filter Scopes available.
Filter Scope | Description |
|---|---|
Auto | This is the default value. It means: If you put the slicer on a container, the scope of filtering can be limited to the container and the data will be filtered in the container based on slicer filter criteria. If you put the slicer on the page, the filter scope is page, and the data will be filtered on the same page as per the slicer filter criteria. |
Page | If this option is selected, then the filter scope is page, and the data will be filtered on the same page as per the slicer filter criteria. |
Dashboard | If this option is selected, then you can use the cross-page filtering ability of the slicer to work with multi-page dashboards. Example: You have multiple pages in a dashboard. On the first page of the dashboard, you have a slicer and on the second page you have a chart, and you select the Filter Scope as Dashboard. This will filter out the data on the second page as well, based on the slicer filter value selected on the first page. |
Note: Once the scope of the slicer is set to Dashboard, it will take effect on all the charts/slicers bound to the same datasets and cannot be canceled for a certain chart/slicer unless the scope of the slicer is set to Auto or Page.
Supported Slicer Types
Label Slicer
Multi-dimensional Slicer
Multi-dimensional Dropdown Slicer
Data Range Slicer
Date Range Slicer
Relative Dates Slicer
Slicer filter scope when putting the slicer on the container
The table below describes the 'Slicer filter scope' when a slicer is put on the container.
Container Filter Scope Slicer Filter Scope | Container | Page |
|---|---|---|
Auto | Container | Page |
Page | Page | Page |
Dashboard | Dashboard | Dashboard |