- Getting Started
- Administration Guide
-
User Guide
- An Introduction to Wyn Enterprise
- Document Portal for End Users
- Data Governance and Modeling
- Working with Resources
- Working with Reports
-
Working with Dashboards
- Dashboard Designer
- Selecting a Dataset
- Data Attributes
- Dashboard Scenarios
- Dashboard Templates
- Component Templates
- 3D Scene
- Explorer
- Visualization Wizard
- Data Analysis and Interactivity
- Dashboard Appearance
- Preview Dashboard
- Export Dashboard
- Dashboard Lite Viewer
- Using Dashboard Designer
- Animating Dashboard Components
- Document Binder
- Dashboard Insights
- View and Manage Documents
- Understanding Wyn Analytical Expressions
- Section 508 Compliance
- Subscribe to RSS Feed for Wyn Builds Site
- Developer Guide
Pass Dynamic Parameter to Native Query Dataset
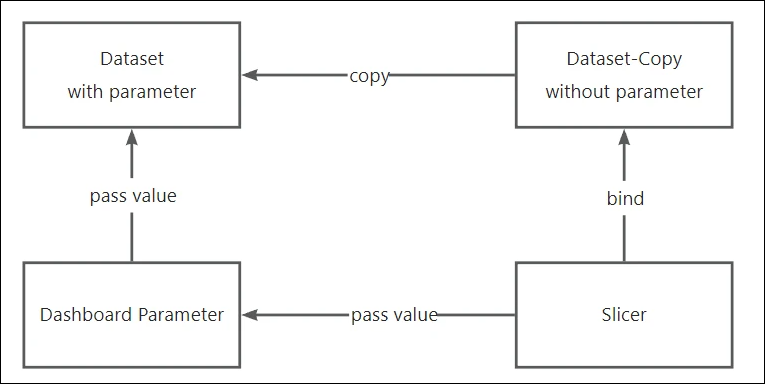
You can pass a dynamic parameter (which means a parameter bound to the slicer whose data is from the query, or a parameter bound to a selected value) to a native query dataset. For this, you need to bind the slicer fields and chart fields to the native query dataset and this native query dataset can be the same or different for the slicer and chart. On preview when you select any item on the slicer, the data will be displayed on the chart as per the native query dataset. So, you can select from the dashboard slicer to filter on the native query dataset dynamically.
Example: In this example, we will bind a Lable Slicer and a Column Chart. To avoid a data loop, we will bind a different dataset to the slicer, and the dataset should provide all available values of the target dataset parameter, so it is better to copy from the target dataset and remove the parameter, as shown below in the figure.
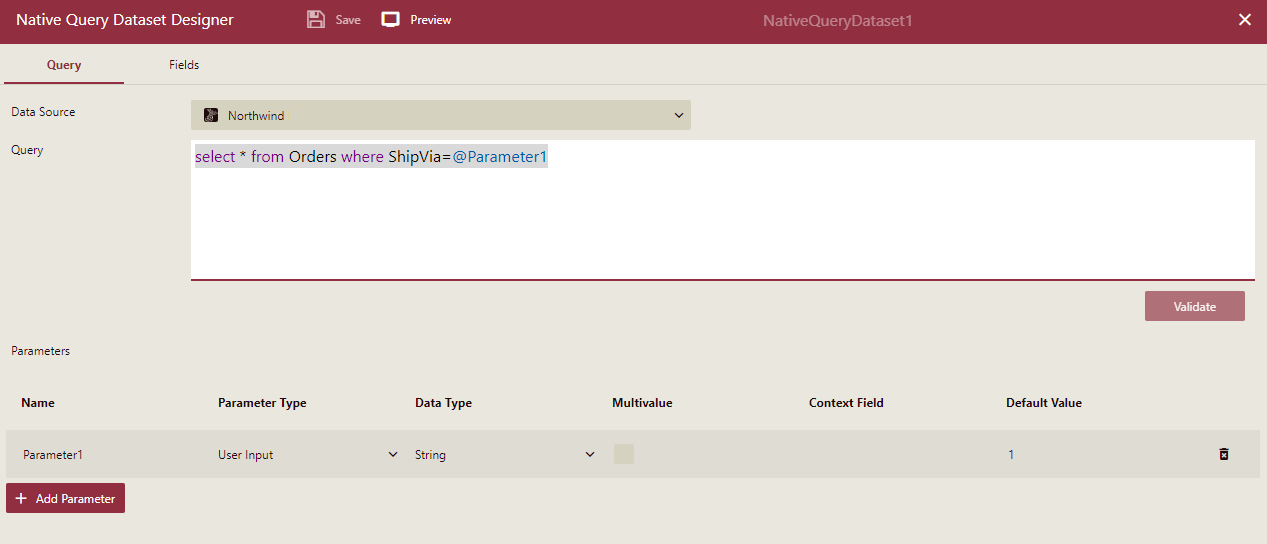
There is a dataset (NativeQueryDataset1) with a parameter 'Parameter1' and a query 'select * from Orders where shipVia = @Parameter1'.
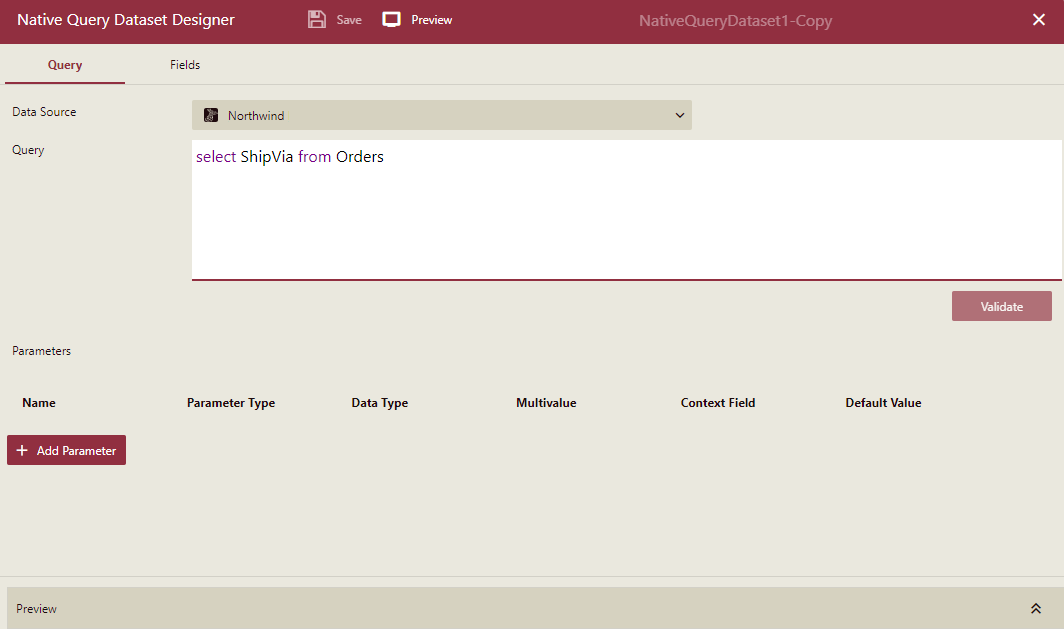
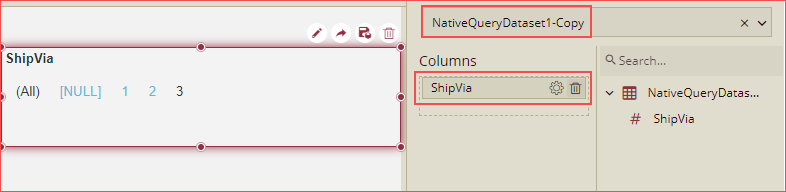
Duplicate this dataset (NativeQueryDataset1-copy), remove the parameter, and change the query to 'select ShipVia from Orders'. The purpose of the step is to create data to provide available parameter values.
Create a dashboard and add a label slicer, bind it to 'NativeQueryDataset1-copy', and add ShipVia to the slicer's Columns field.
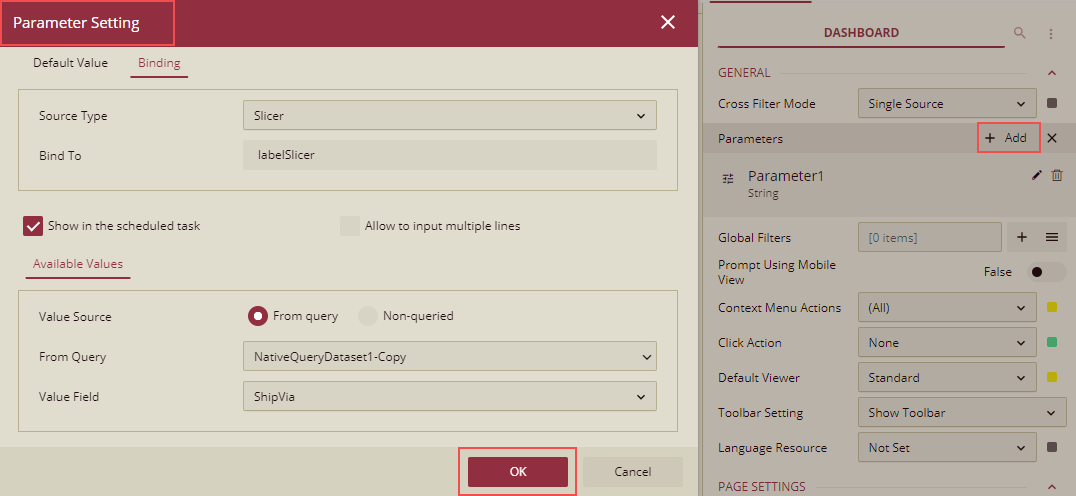
Add a dashboard parameter (Parameter1) and bind it to the slicer.
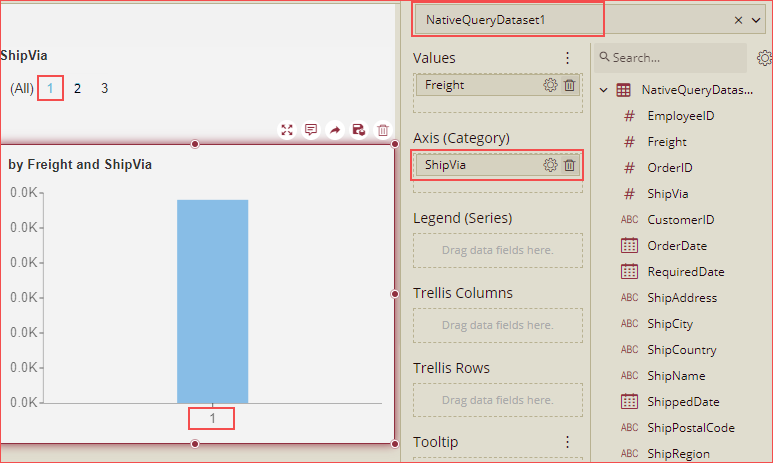
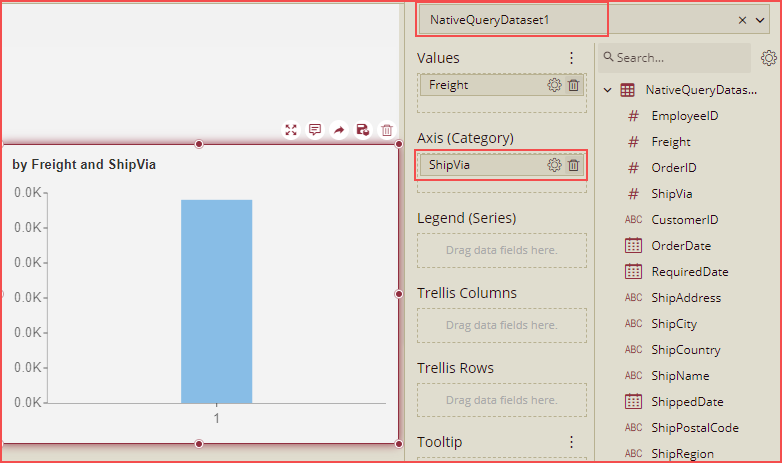
Add a Column Chart, bind it to 'NativeQueryDataset1', and drag ShipVia to Axis (Category) and Freight to Values.
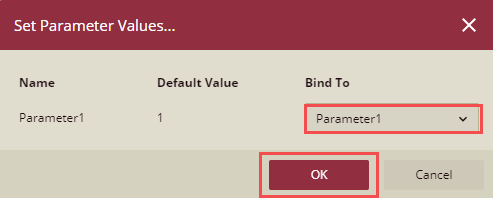
Click Set Parameter Values to open the Set Parameter Values dialog box.
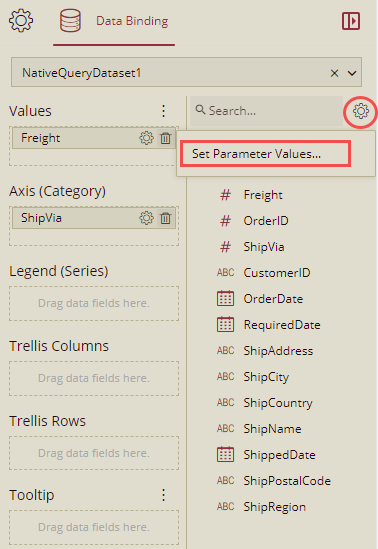
Bind to Parameter1 and click OK.
Preview the dashboard and click any item on the slicer, the data will be displayed on the chart as per the native query dataset.