- Getting Started
- Administration Guide
-
User Guide
- An Introduction to Wyn Enterprise
- Document Portal for End Users
- Data Governance and Modeling
- Working with Resources
- Working with Reports
-
Working with Dashboards
- Dashboard Designer
- Selecting a Dataset
- Data Attributes
- Dashboard Scenarios
- Dashboard Templates
- Component Templates
- 3D Scene
- Explorer
- Visualization Wizard
- Data Analysis and Interactivity
- Dashboard Appearance
- Preview Dashboard
- Export Dashboard
- Dashboard Lite Viewer
- Using Dashboard Designer
- Animating Dashboard Components
- Document Binder
- Dashboard Insights
- Add a New Page in Dashboard Designer
- View and Manage Documents
- Understanding Wyn Analytical Expressions
- Section 508 Compliance
- Subscribe to RSS Feed for Wyn Builds Site
- Developer Guide
Quick Functions
The Quick Functions let you apply powerful calculations on measures to highlight the key indicators in a dashboard.
In Wyn Dashboards, there are a variety of predefined quick functions that makes it easier for you to apply complex calculations on measures. You can also modify the quick functions as per your requirements to achieve a specific result. These functions include date based, ranking calculation, percentile calculation, running calculation, moving calculation, each described below in detail.
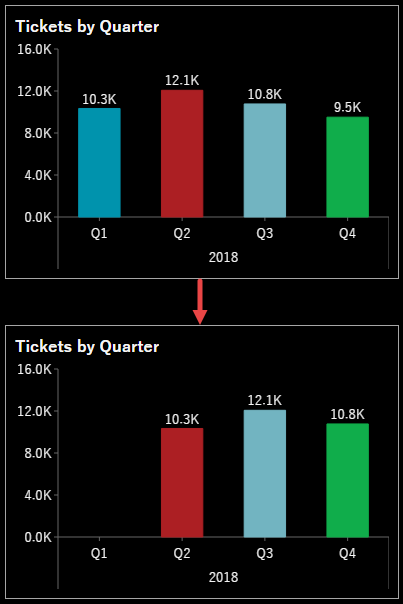
Date Based Functions
With Date Based functions, you can create comparison visuals between the data in different date ranges, like year-over-year, month-over-month, etc., or display the values for a specific date range in a pre-defined offset like last year data by months.
Let's say, if you choose Past Quarter (under Past Value) for the date based function, then each quarter will show the value for the last quarter, like quarter Q3 shows the value for quarter Q2, quarter Q2 shows the value for quarter Q1, while quarter Q1 will not display any value because no data is left.
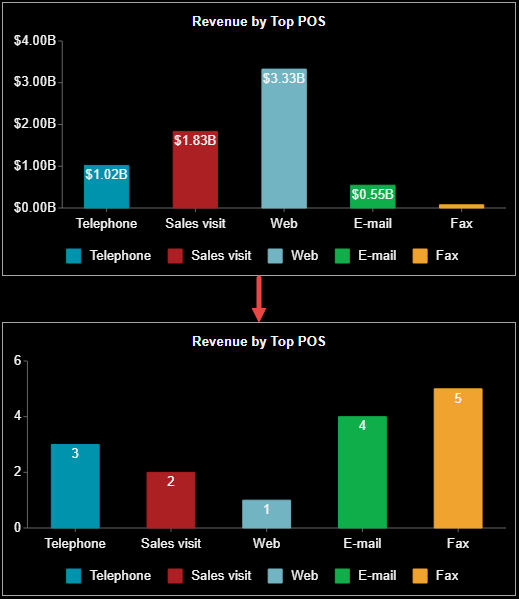
Ranking Calculation
Use Ranking Calculation to rank the data values in a specified range within the scenario. When you apply the function, the data values within the scenario are replaced with the corresponding ranking values.
For example, we applied a ranking calculation in a scenario to rank the POSs based on the total revenue. The first rank in the scenario indicates the POS with the largest revenue value, that is, Web, while the fifth rank indicates the POS with the smallest revenue value, that is, Fax.
Refer to the following table that describes the different fields available in the Ranking Calculation dialog.
| Field | Description |
|---|---|
| Along | Specify whether you want to apply the ranking along the rows, columns, axis (category), legend (series), and so on. |
| Rank Order | Specify the ranking order for the data values, that is, either Top or Bottom. 'Top' ranks the data values from largest to smallest values and 'Bottom' ranks the data values from smallest to largest values. |
| Equal As | Choose the rule for ranking the data values, that is, Unique (1,2,3,4), Competition (1,2,2,4), Modified Competition (1,3,3,4), and Dense (1,2,2,3). By default, this field is set to Unique (1,2,3,4). |
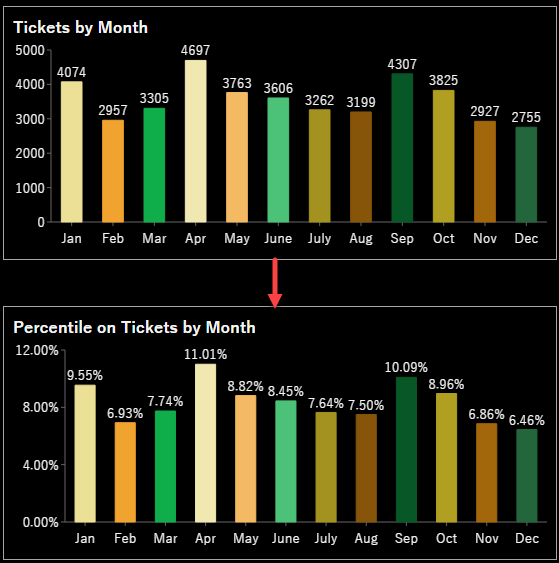
Percentile Calculation
Percentile Calculation displays the value below which a certain percent of observations fall. It expresses each measure value as a percentage of rows, columns, axis (category), legend (series) etc. based on your selection.
The below chart scenario displays each month's tickets as a percentage of the total tickets for all the months.
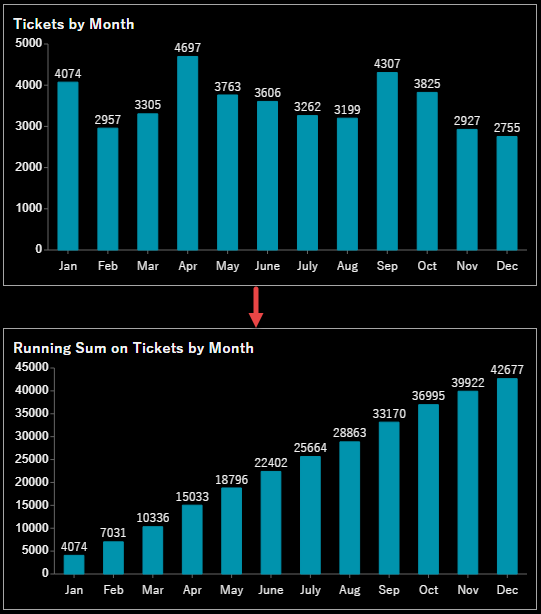
Running Calculation
Apply Running Calculation to compute the cumulative sum of a measure within a scenario, generated by adding the new data value to the previous data value. You can also specify the type of aggregation method you want to use to summarize the data values in Running Calculation like sum, average, max, min, and count.
The following chart scenario calculates the total running sum of all the tickets for each month, starting from January till December.
Refer to the following table that describes the fields available in the Running Calculation dialog.
| Field | Description |
|---|---|
| Calculation Type | Choose the type of aggregation method you want to perform on the measure - sum, average, max, min, and count. |
| Along | Specify whether you want to apply the running calculation along the total chart, trellis rows, trellis columns, etc. |
Moving Calculation
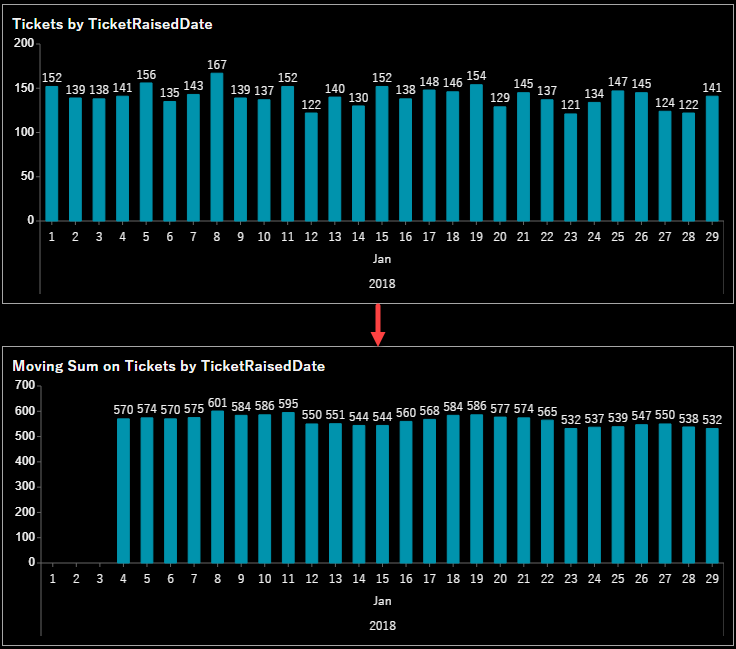
As the name suggests, Moving Calculation is the calculation that moves along the time scale such that the old value is dropped when the new value becomes available. You can specify the aggregation method of your choice when defining the Moving Calculation for a measure like sum, average, max, and min. This quick function helps you to analyze and determine the overall trends in the data more clearly.
For example, a '4 - day moving sum' is the 4 - day sum of tickets as shown in the following image. The moving sum for day 4 is day 1 + day 2 + day 3 + day 4, that is, 152 + 139 + 138 + 141 = 570. While for day 5, it is day 2 + day 3 + day 4 + day 5, that is, 139 + 138 + 141 + 156 = 574, and so on. This implies that as we move forward, the old value is replaced with the next new value.
The following table describes the various fields that you can set in the Moving Calculation dialog.
| Field | Description |
|---|---|
| Calculation Type | Choose the type of aggregation method you want to perform on the measure - sum, average, max, and min. |
| Along | Specify whether you want to apply the moving calculation along the total chart, trellis rows, trellis columns, etc. |
| Values Before | Specify the count of data values that you want to include before the current value. |
| Values After | Specify the count of data values that you want to include after the current value. |
| Include Current Value | Check or uncheck to include or exclude the current value from the calculation. |
Original Value
To remove a quick function applied to a measure that you no longer require, select 'Original Value' as shown. It returns the original measure value in the scenario.
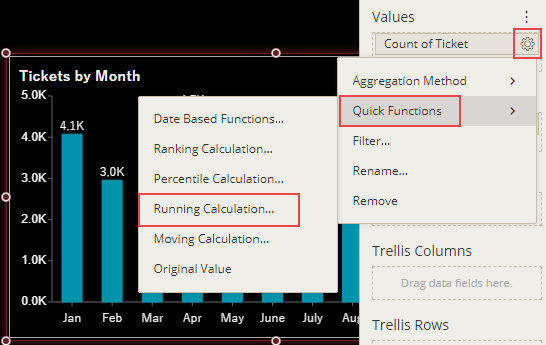
To Apply a Quick Function
In the Data Binding tab
 of the selected scenario, go to the measure's settings
  under the Value section and select Quick Functions.
Choose a quick function that you want to apply to the measure. For example, select 'Running Calculation' to calculate the running sum of the tickets in the scenario.
In the Running Calculation dialog, set the Calculation Type to an appropriate aggregation method from the list, for example, Sum.
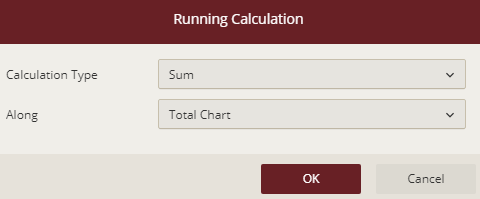
Set Along to a suitable option from the list like total chart, trellis rows, trellis columns, etc. depending on your requirements.
Click OK to save the changes.