- Getting Started
- Administration Guide
-
User Guide
- An Introduction to Wyn Enterprise
- Document Portal for End Users
- Data Governance and Modeling
- Working with Resources
- Working with Reports
-
Working with Dashboards
- Dashboard Designer
- Selecting a Dataset
- Data Attributes
- Dashboard Scenarios
- Dashboard Templates
- Component Templates
- 3D Scene
- Explorer
- Visualization Wizard
- Data Analysis and Interactivity
- Dashboard Appearance
- Preview Dashboard
- Export Dashboard
- Dashboard Lite Viewer
- Using Dashboard Designer
- Animating Dashboard Components
- Document Binder
- Dashboard Insights
- Add a New Page in Dashboard Designer
- View and Manage Documents
- Understanding Wyn Analytical Expressions
- Section 508 Compliance
- Subscribe to RSS Feed for Wyn Builds Site
- Developer Guide
Measures and Calculated Columns
Measures and calculated columns are used to perform complex arithmetic calculations on your data. They enable you to extract new data from the existing data, available in the datasets and data models, with the help of analytical expressions. An analytical expression consists of functions, operators, and value references, which are evaluated as a formula to generate results.
In general, measures are used to perform aggregate operations on the table such as total, count, average, percentage, and more. While calculated columns are used to perform row-by-row calculations on the target table. Note that measures and calculated columns can only reference attributes in analytical expressions. To learn more about measures and calculated columns, please see this article.
In this help article, you will find information on the following,
To Add a Measure
Consider a sales table, namely FactOnlineSales that contains sales, discounts, and returns information. We can use this table to calculate online sales' gross profit using the analytical expression below.
SUMX (
    FactOnlineSales,
    FactOnlineSales[SalesAmount] - FactOnlineSales[DiscountAmount] - FactOnlineSales[ReturnAmount] - FactOnlineSales[UnitCost] * ( FactOnlineSales[SalesQuantity] - FactOnlineSales[ReturnQuantity] )
)
Follow the below steps to add a measure with the above expression to the FactOnlineSales table.
From the Data Binding panel on the left, select the DimCustomer table.
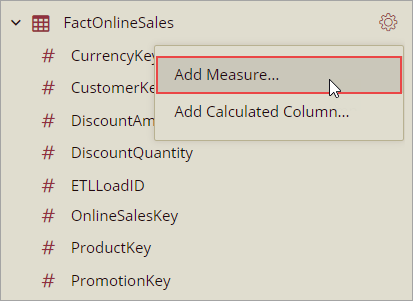
Click the Settings icon and then choose the Add Measure option from the list.
In the WAX Expression Editor, enter the expression for the gross profit.
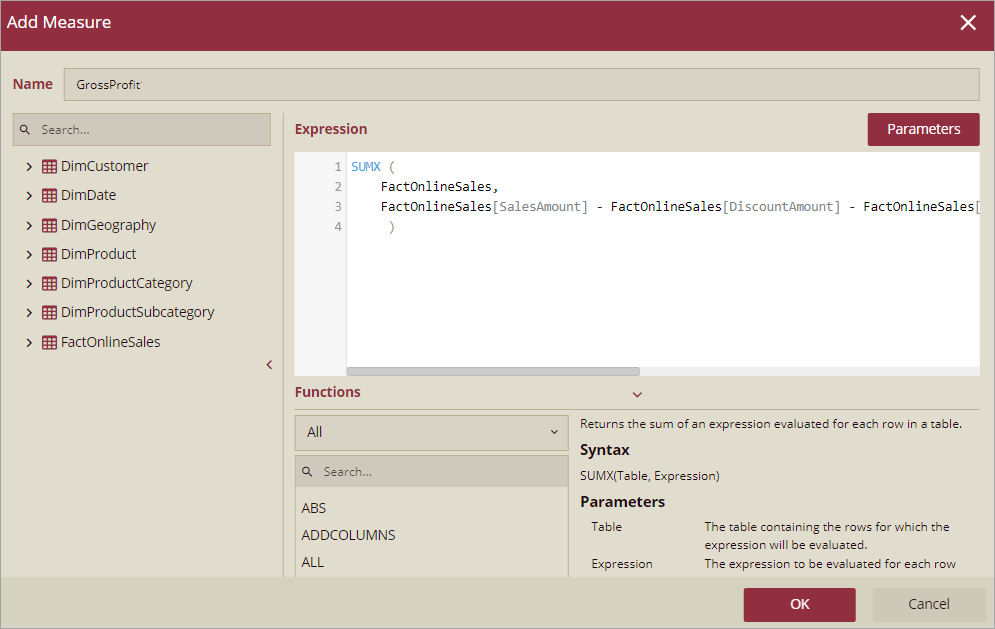
Then, click the OK button.
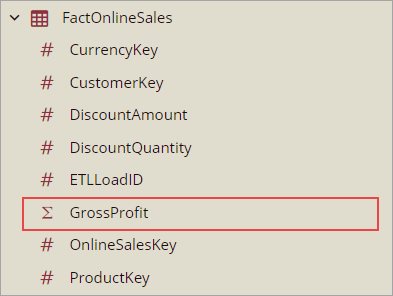
The measure now appears under the chosen table in the Data Binding panel along with its other attributes.
To Add Calculated Column
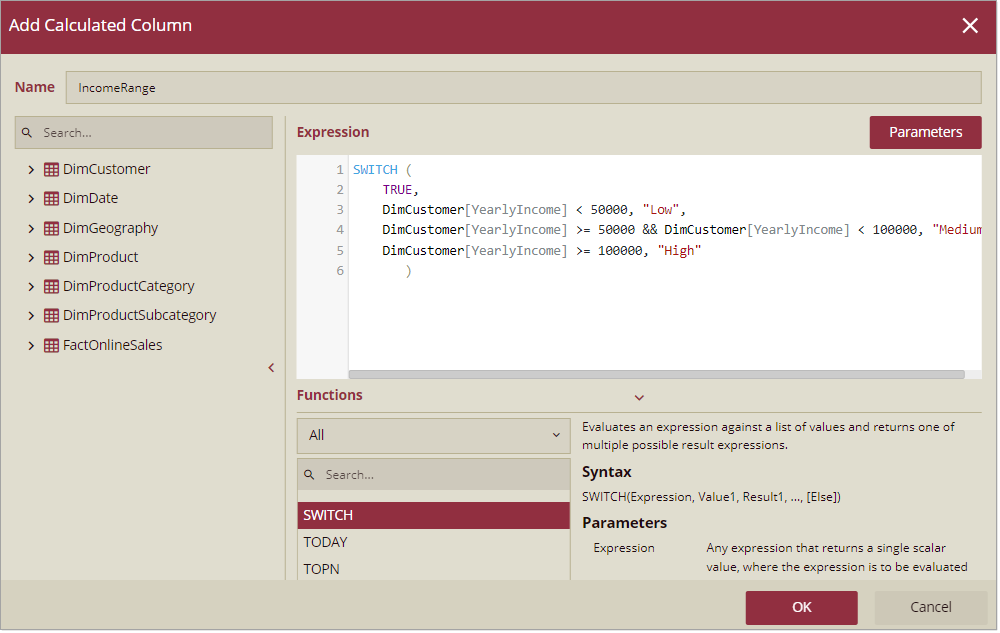
Let's say, you want to use the 'DimCustomer' table to divide the customers into groups based on their yearly income. To achieve this, use the following expression for the calculated column, which will categorize the customers into 'Low', 'Medium', and 'High' according to their yearly income.
SWITCH (
    TRUE,
    DimCustomer[YearlyIncome] < 50000, "Low",
    DimCustomer[YearlyIncome] >= 50000 && DimCustomer[YearlyIncome] < 100000, "Medium",
    DimCustomer[YearlyIncome] >= 100000, "High"
)
Follow the below steps to add a calculated column with the above expression to the 'DimCustomer' table.
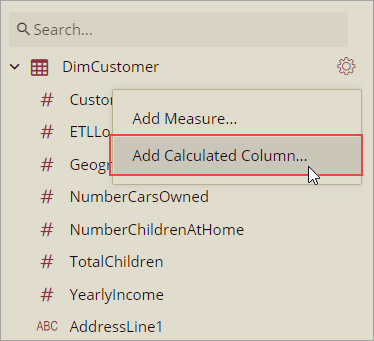
From the Data Binding panel on the left, select the 'DimCustomer' table.
Click the Settings icon and then choose the Add Calculated Column option from the list.
In the Expression Editor, enter the expression for the income range.
Then, click the OK button.
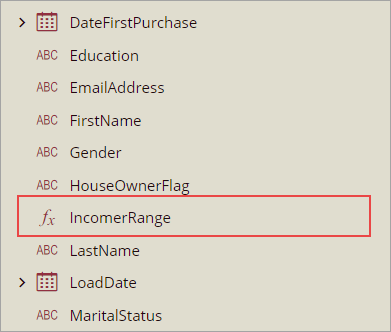
The calculated column now appears under the chosen table in the Data Binding panel along with its other attributes.
To Edit a Measure or a Calculated Column
Follow the below steps to edit a measure or a calculated column in an table.
From the Data Binding panel on the right, select the table which contains the measure or calculated column you want to modify.
Choose the measure or calculated column and click the Settings icon next to it.
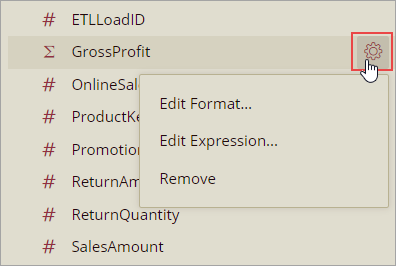
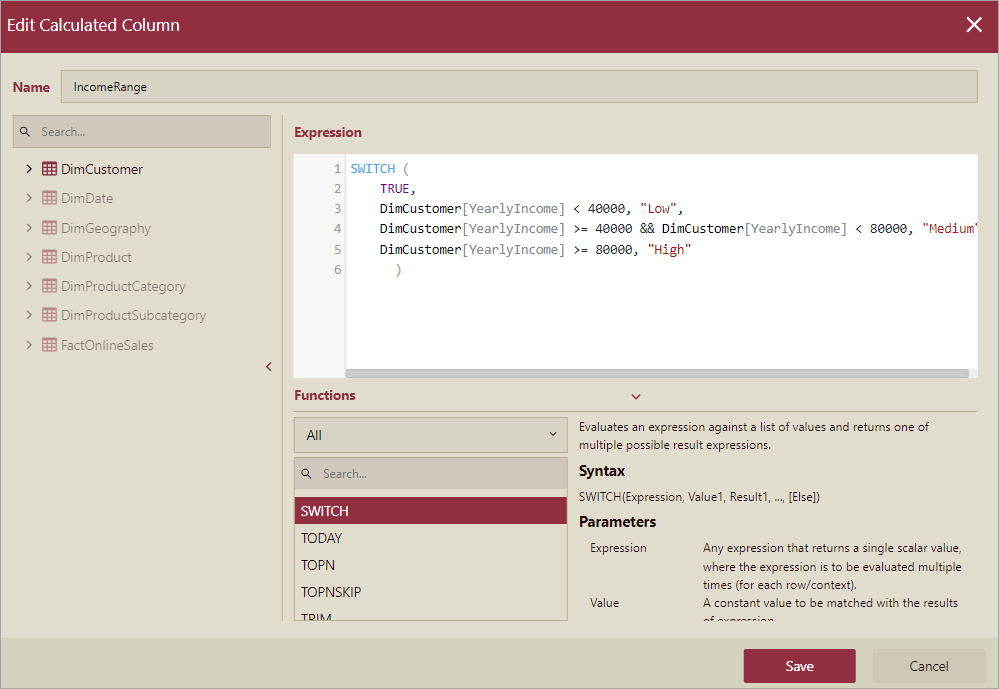
If you want to enter a new expression or update the existing expression for the measure or calculated column, choose the Edit Expression option. The Expression Editor appears as shown below.
Note: You cannot edit or update the expression for a data model measure or calculated column.
If you want to modify the format of the measure or calculated column, choose the Edit Format option. The Format Field dialog box appears as shown below.

For more information on data format, please see this article.
To Delete a Measure or a Calculated Column
Follow the below steps to delete a measure or calculated column from the bound model.
Note: You cannot remove or delete a data model measure or calculated column in the dashboard designer.
From the Data Binding panel on the right, select the table which contains the measure or calculated you no longer require.
Choose the measure or calculated column and click the Settings icon next to it.
Select the Remove option from the list.
The chosen measure or calculated column is now deleted.
SelectedValue and SelectedRange Functions to Filter Values
The SelectedValue function is used to filter out values from the target column. SelectedValue is a front-end expression and the dashboard will replace the expression with an actual value before sending the pivot request to the WAX engine. SelectedValue expression only takes care of the Exact and Range filter types. It only can be used in the Calculated Measure and not in the Calculated Column.
The interpolated expression to get filtered data will be replaced by the value when the context for columnName has been filtered down to one distinct value only. Otherwise, it returns an alternate result.
Syntax
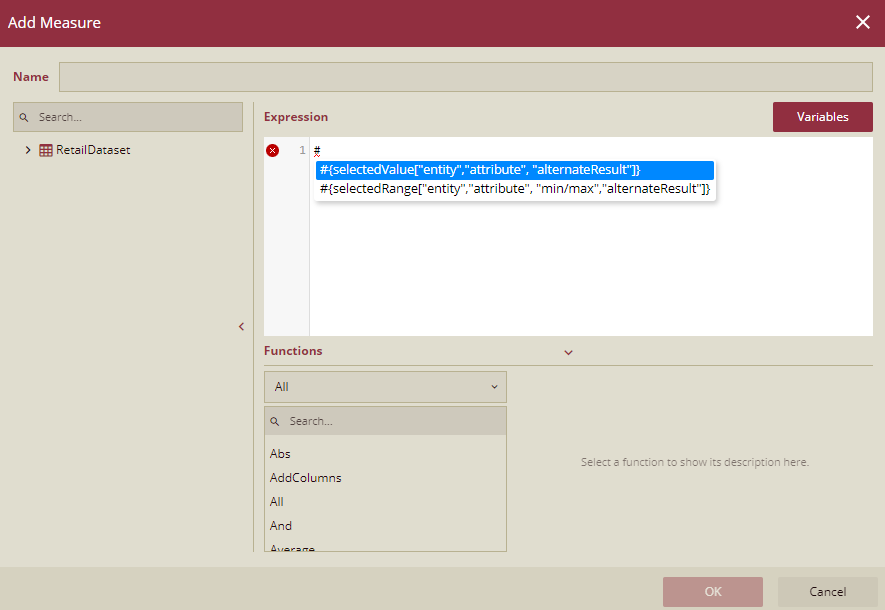
#{selectedValue["entity","attribute", "alternateResult"]}
#{selectedRange["entity","attribute", "min/max","alternateResult"]}
The "entity" and "attribute" names should be replaced by the target table and column/calculated column. The return data type is a string.
Parameters
Parameter | Description |
|---|---|
entity | The name of an existing table. It cannot be an expression. |
attribute | The name of an existing column. It cannot be an expression. |
alternateResult | The value returned when the column has no filter or more than 1 distinct value. |
min/max | The target value type (Only available on range value, such as data range and date range) |
Ways to add SelectedValue/SelectedRange expression
There are two ways to insert the SelectedValue/SelectedRange expression into the WAX:
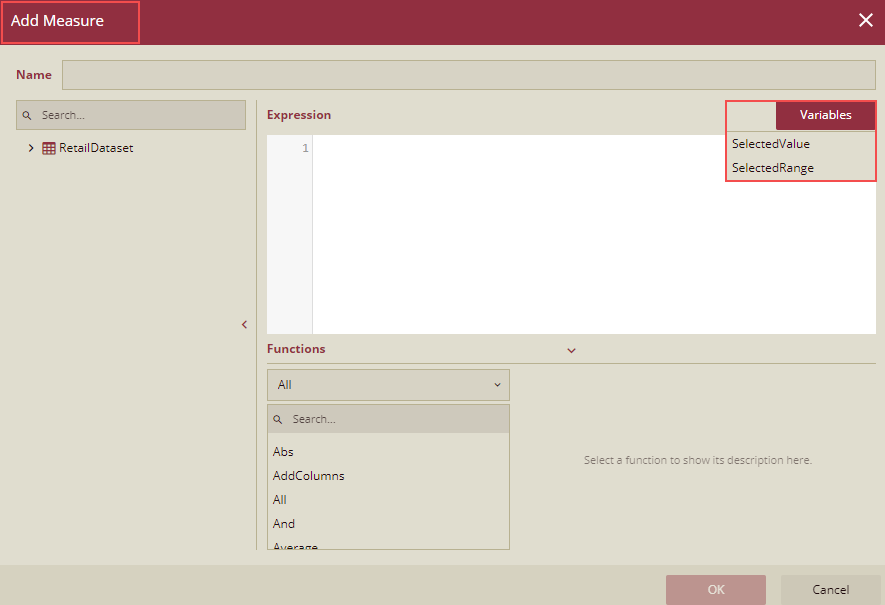
First one is, on the Add Measure dialog box, click the Variables button and select the SelectedValue/SelectedRange option to apply the SelectedValue/SelectedRange function to the expression editor.
Second one is, you can type # and use the auto-complete suggestion.
Use Case 1: Display the sum of unit price based on the product selected in the slicer by using the SelectedValue function.
Create a dashboard with 1 slicer and 1 column chart, and a Pivot Table and bind all three to a dataset.
On the Slicer drag the Product field to the Columns.
On the Column Chart, drag Sum of Unit Price to Values and Product to Axis.
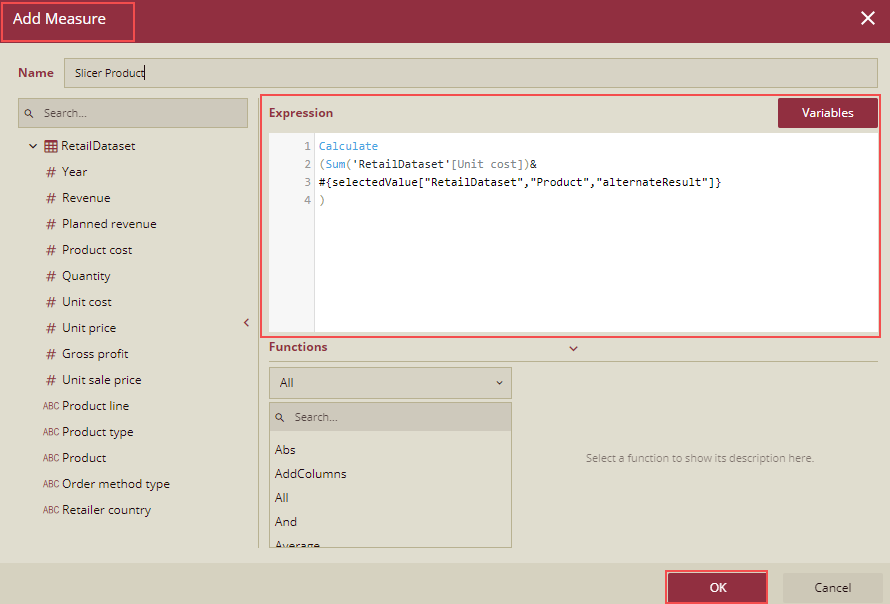
On the Pivot table, select the dataset and add a measure.
Add Measure dialog box is displayed. Add the following expression and save it as Slicer Product.
Calculate
(Sum('RetailDataset'[Unit price])&
#{selectedValue["RetailDataset","Product","alternateResult"]}
)
On the Pivot table, drag this measure Slicer Product to the Values and drag the Product to the Rows.
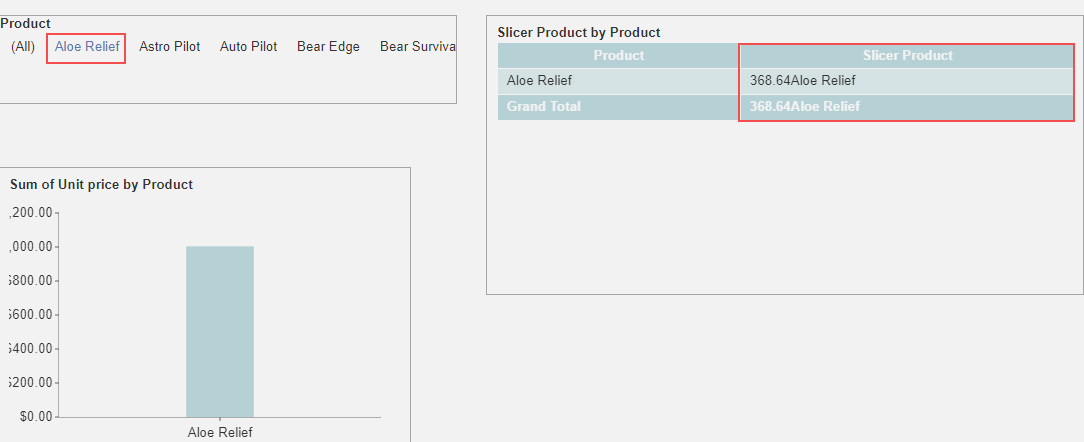
The dashboard will look like the one shown below.
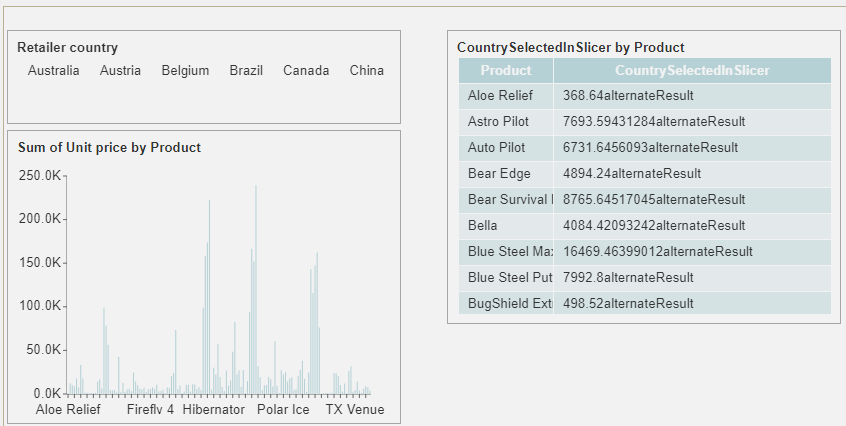
Preview the dashboard.
On the preview, select any product on the slicer. The details of that particular product are displayed.
Use Case 2: To display the sum of Payout between a date range by using a SelectedRange function.
Create a dashboard with a Date Range slicer, a Column Chart, and a Data Table and bind all three to a dataset.
On the Date Range Slicer drag the CalimPayoutDate field to the Columns. In the Inspector tab, under the Date Slicer Settingsset the Display Mode property to Date Range.
On the Column Chart, select the dataset and add a measure.
Add Measure dialog box is displayed. Add the following expression and save it as PayoutSum.
var minS = #{selectedRange["InsuranceDataset", "ClaimPayoutDate", "min", "1900-01-01")]}
var maxS = #{selectedRange["InsuranceDataset", "ClaimPayoutDate", "max", "2099-01-01")]}

var minDate = DateAdd(Date(Year(minS), Month(minS), Day(minS)), 1, Month)
var maxDate = DateAdd(DateAdd(Date(Year(maxS), Month(maxS), Day(maxS)), 1, Month), -1, Day)

return Calculate(
  Sum('InsuranceDataset'[Payout]),
  RemoveFilters('InsuranceDataset'[ClaimPayoutDate]),
  'InsuranceDataset'[ClaimPayoutDate] >= minDate,
  'InsuranceDataset'[ClaimPayoutDate] <= maxDate)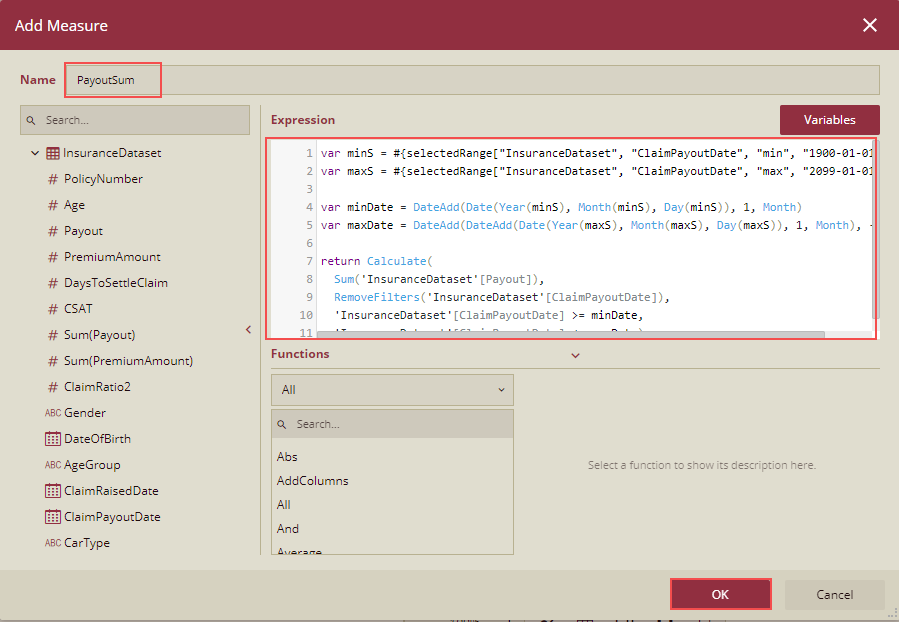
On the Column Chart, drag this measure PayoutSum to the Values.
On the Data table, drag the CalimPayoutDate and Payout fields to Columns.
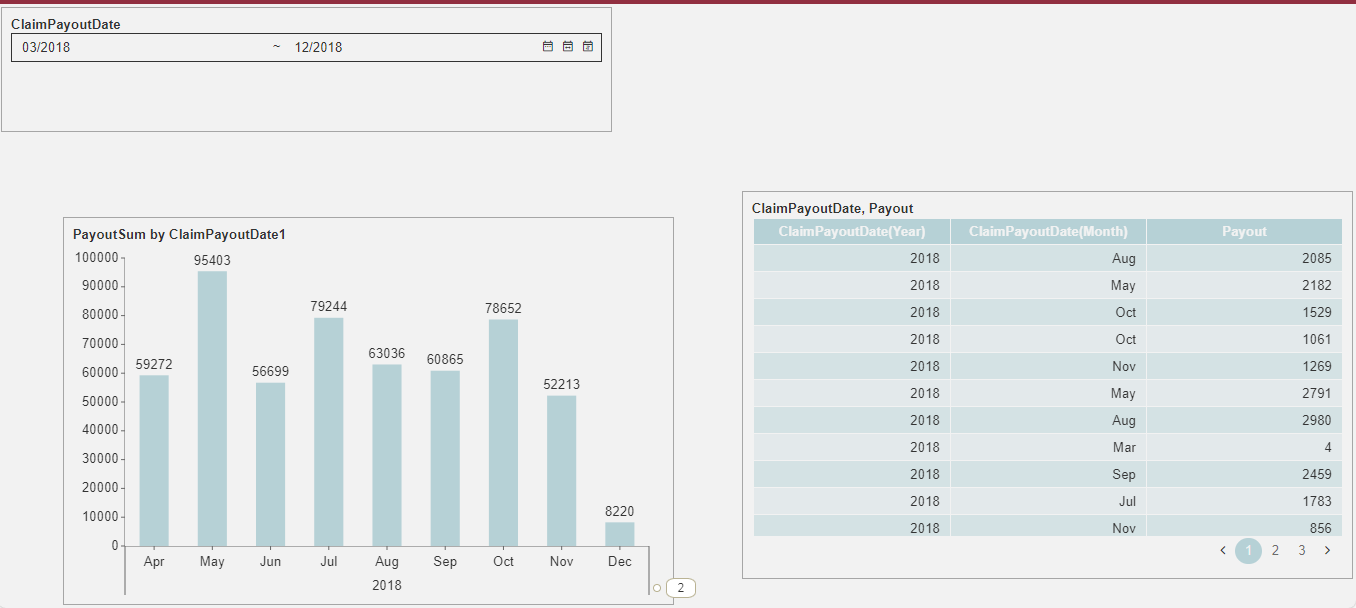
The dashboard will look like the one shown below.
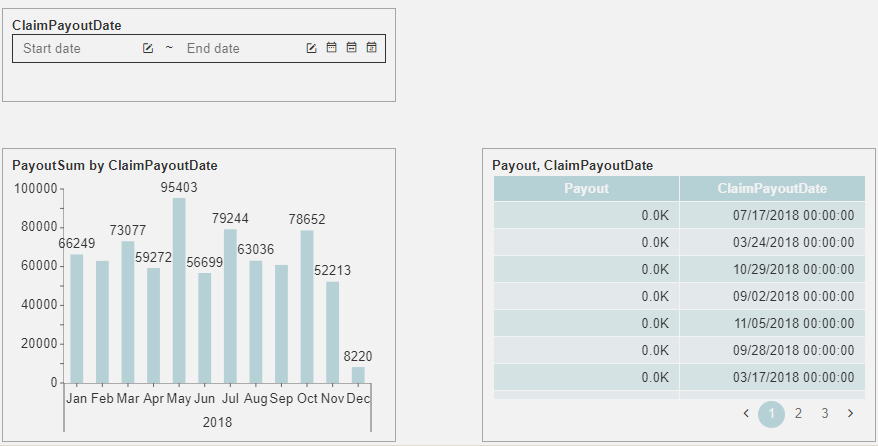
Preview the dashboard. On the preview, select the Start Date and End Date on the slicer CalimPayoutDate. The Sum of Payouts for the selected date range will be displayed on the Column chart and in the Data Table as well.
Use Case 3: To display the sum of the YoY Order Amount by using a SelectedRange function.
Create a dashboard with a Relative Date slicer, a Data Table, and a Column Chart, and bind all three to a dataset.
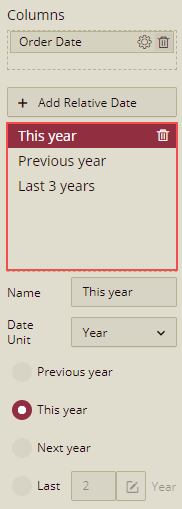
On the Relative Date slicer drag the Order Date field to the Columns. Click the Add Relative Date button to add the relative dates as This Year, Previous Year, and the Last 3 Years.
On the Column Chart, select the dataset and add a measure.
The Addd Measure dialog box is displayed. Add the following expression and save it as YoYCalcOrderAmount.
var minS = #{selectedRange["Yoy Dataset Nams Final", "Order date", "min", "1900-01-01")]}
var maxS = #{selectedRange["Yoy Dataset Nams Final", "Order date", "max", "2099-01-01")]}

var minDate = DateAdd(Date(Year(minS), Month(minS), Day(minS)), 1, Year)
var maxDate = DateAdd(DateAdd(Date(Year(maxS), Month(maxS), Day(maxS)), 1, Year), -1, Day)

return Calculate(
  Sum('Yoy Dataset Nams Final'[Order Amount]),
  RemoveFilters('Yoy Dataset Nams Final'[Order Date]),
  'Yoy Dataset Nams Final'[Order Date] >= minDate,
 'Yoy Dataset Nams Final'[Order Date] <= maxDate)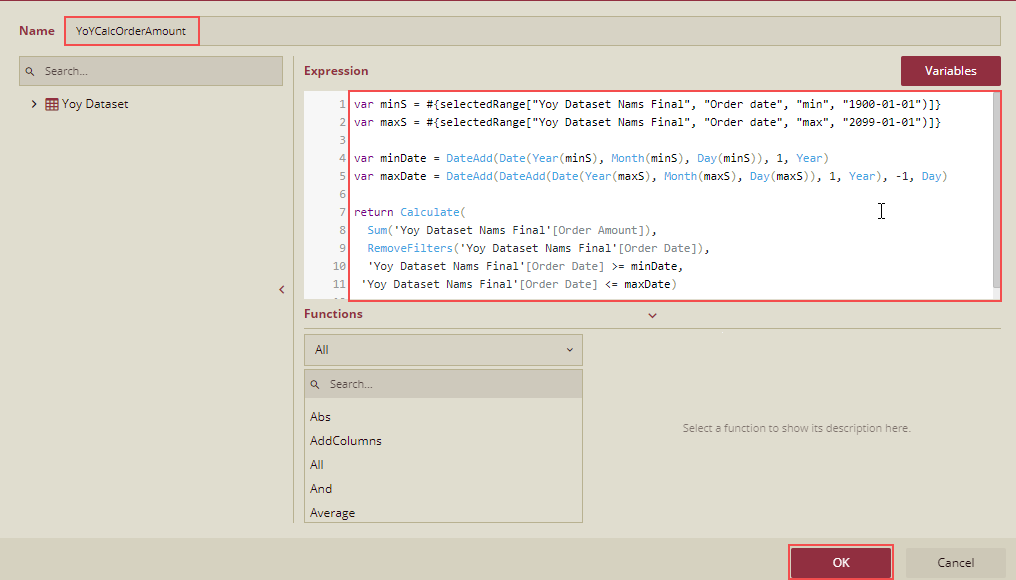
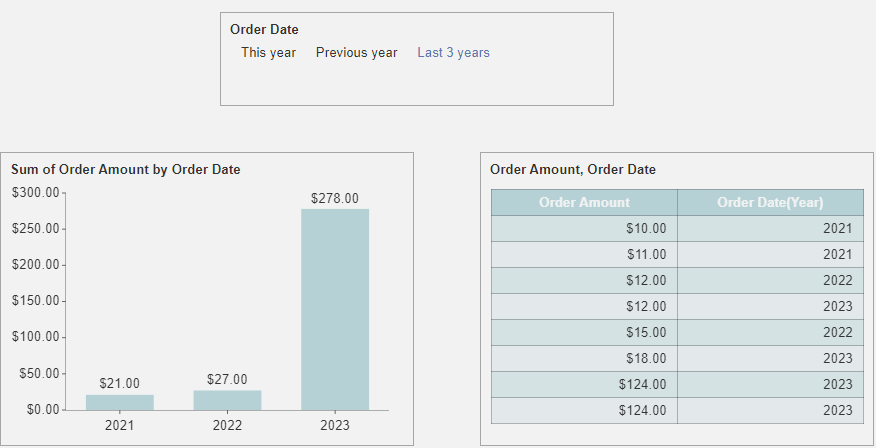
On the Column Chart, drag this measure YoYCalcOrderAmount to the Values.
On the Data table, drag the CalimPayoutDate and Order Amount fields to Columns.
The dashboard will look like the one shown below.
Preview the dashboard. On the preview, select the Order Date on the slicer. The Sum of Order Amount for the selected Order Date will be displayed on the Column chart and in the Data Table as well.
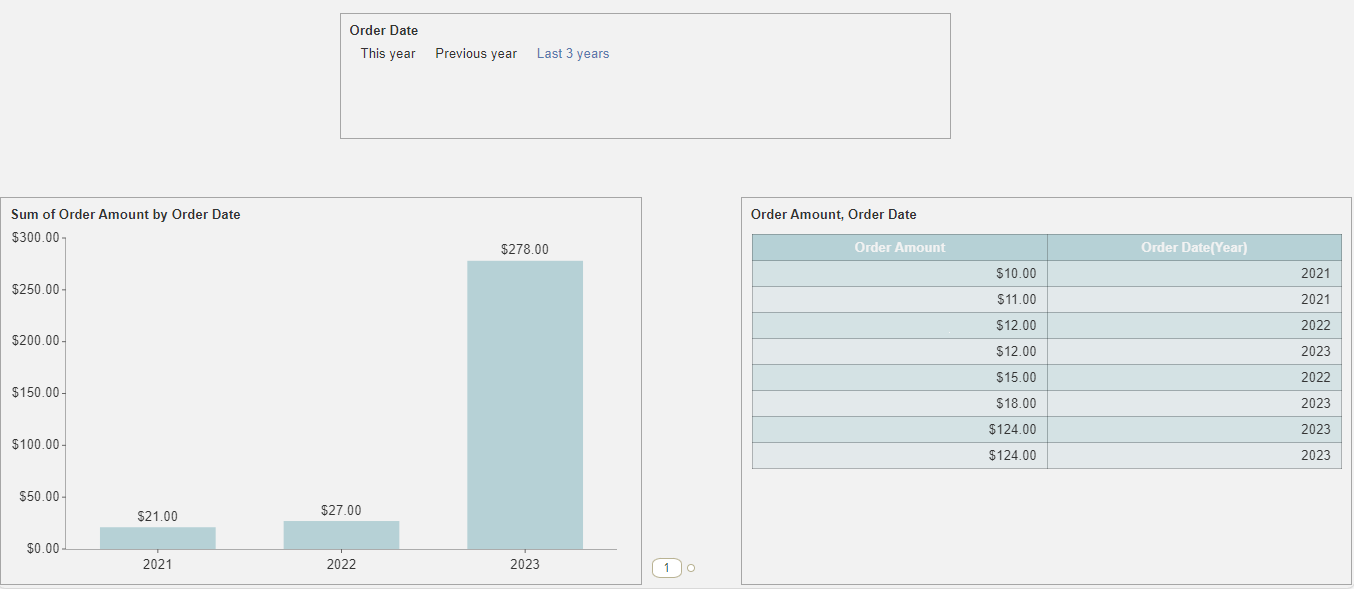
Note: So you can use the SelectedRange function to calculate the YoY data.
See Also
Understanding Analytical Expressions
Measures and Calculated Columns in Dashboards