- Getting Started
- Administration Guide
-
User Guide
- An Introduction to Wyn Enterprise
- Document Portal for End Users
- Data Governance and Modeling
- Working with Resources
- Working with Reports
-
Working with Dashboards
- Dashboard Designer
- Selecting a Dataset
- Data Attributes
- Dashboard Scenarios
- Dashboard Templates
- Component Templates
- 3D Scene
- Explorer
- Visualization Wizard
- Data Analysis and Interactivity
- Dashboard Appearance
- Preview Dashboard
- Export Dashboard
- Dashboard Lite Viewer
- Using Dashboard Designer
- Animating Dashboard Components
- Document Binder
- Dashboard Insights
- Add a New Page in Dashboard Designer
- View and Manage Documents
- Understanding Wyn Analytical Expressions
- Section 508 Compliance
- Subscribe to RSS Feed for Wyn Builds Site
- Developer Guide
Modify Display Unit
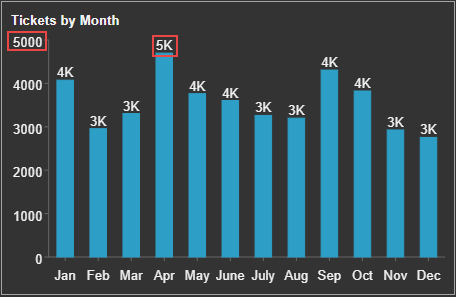
You may want to display unit of measures according to the scenario described in the dashboard to eliminate ambiguity - for example in thousands, millions, or billions. The display unit can be modified from the Data Binding panel or from the Inspector panel for the selected scenario.
The priority of Display Unit property in the Inspector panel is higher than that in the Data Binding panel. This implies that when display unit property is not set in the Inspector panel, then the scenario will use the property specified in the Data Binding panel.
You can change the display unit for Data Labels and Value Axis depending on the selected scenario.
Setting the Display Unit in Data Binding Panel
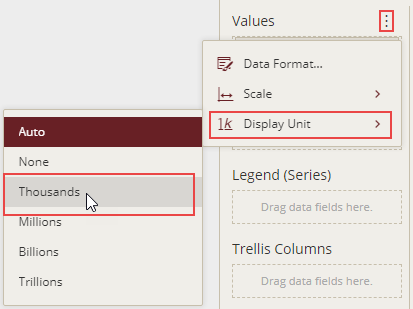
For a Chart scenario,
In the Data Binding panel
 , go to the data binding area.
Click the Ellipsis icon
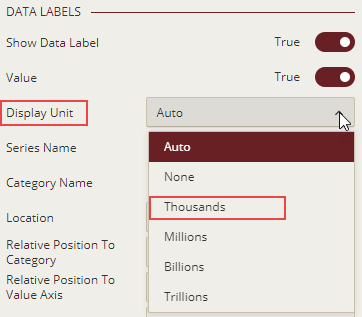
 and select Display Unit.
From the drop-down, select the display unit you want in the scenario.
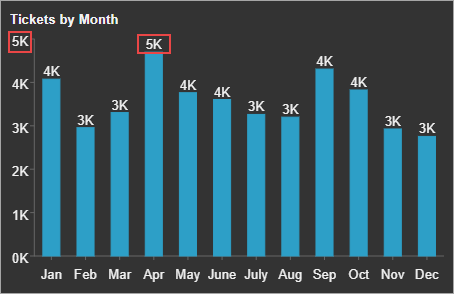
The following image shows the display unit for the value axis and data labels in the chart in 'Thousands'.
For a Table scenario,
In the Data Binding panel
, go to the data binding area.Click the Settings icon
 corresponding to the measure and select Display Unit.
From the drop-down, select the display unit you want in the table (for numerical values).
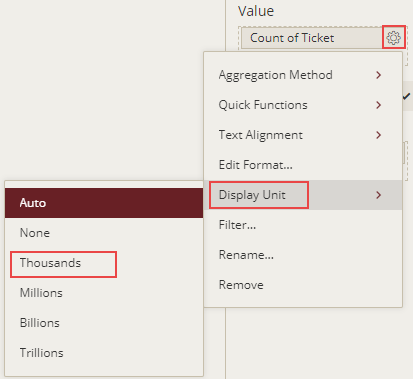
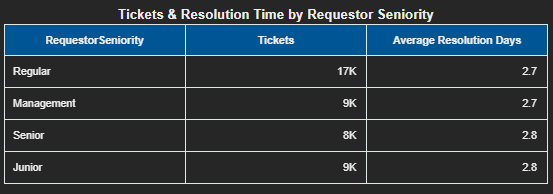
The following image shows the display unit in the Table scenario in 'Thousands'.
Setting the Display Unit from Properties in Inspector Panel
The display unit property in the Inspector panel is available only for the chart scenarios in the designer.
Select a Chart scenario and go to the Inspector panel
 .
.Set the Display Unit property to a suitable unit from the drop-down for Data Labels. You can also modify the display unit for Value Axis.
The following image shows the display unit for data labels in 'Thousands'. Note that the display unit for the value axis remains unchanged.