- Getting Started
- Administration Guide
-
User Guide
- An Introduction to Wyn Enterprise
- Document Portal for End Users
- Data Governance and Modeling
- Working with Resources
- Working with Reports
-
Working with Dashboards
- Dashboard Designer
- Selecting a Dataset
- Data Attributes
- Dashboard Scenarios
- Dashboard Templates
- Component Templates
- 3D Scene
- Explorer
- Visualization Wizard
- Data Analysis and Interactivity
- Dashboard Appearance
- Preview Dashboard
- Export Dashboard
- Dashboard Lite Viewer
- Using Dashboard Designer
- Animating Dashboard Components
- Document Binder
- Dashboard Insights
- Add a New Page in Dashboard Designer
- View and Manage Documents
- Understanding Wyn Analytical Expressions
- Section 508 Compliance
- Subscribe to RSS Feed for Wyn Builds Site
- Developer Guide
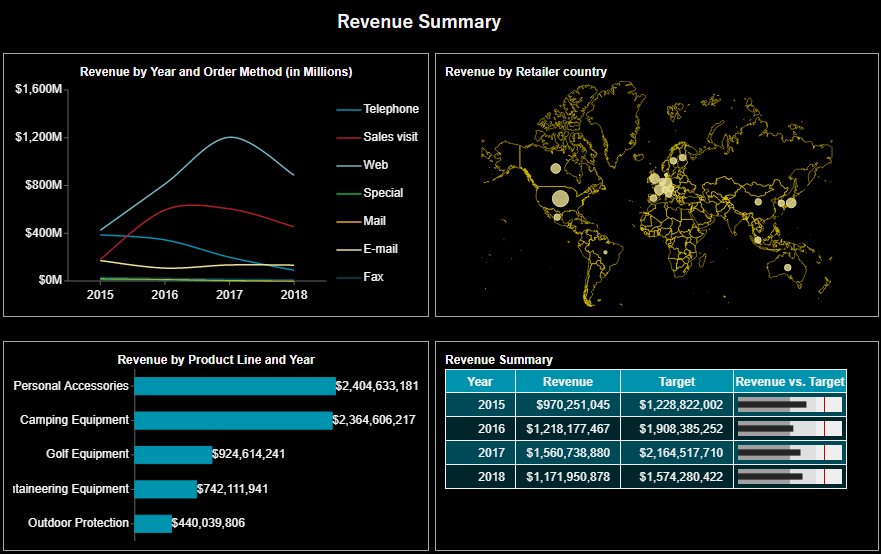
Create a Revenue Summary Dashboard
Revenue Summary Dashboards are generally used by the organizations and companies to help the executives and CFOs to track and analyze the revenue performance. The main functionalities of the revenue summary dashboard is to display the trend in the company's total revenue and the other major categories of revenue like order type, product sales, etc. Have a look at the following revenue summary dashboard. The line chart displays the trend in revenue by the different order method types like web, sales visit, telephone, e-mail, fax, mail, and special. The map chart highlights the revenue by retailer companies; larger the bubble size larger is the revenue for that specific country. The horizontal bar graph indicates the revenue by different product lines, that is, personal accessories, camping equipment, golf equipment, mountaineering equipment, and outdoor protection. The pivot chart compares the revenue and target figures.