- Getting Started
- Administration Guide
-
User Guide
- An Introduction to Wyn Enterprise
- Document Portal for End Users
- Data Governance and Modeling
- Working with Resources
- Working with Reports
- Working with Dashboards
- View and Manage Documents
- Understanding Wyn Analytical Expressions
- Section 508 Compliance
- Subscribe to RSS Feed for Wyn Builds Site
- Developer Guide
Complex Pivot Report
A complex pivot report contains a tablix with added groups.
What You Will Learn
This tutorial guides you through the steps to create a complex Pivot report by adding column groups to a tablix.
Note: You need to complete Create a Simple Pivot Report before performing following steps.
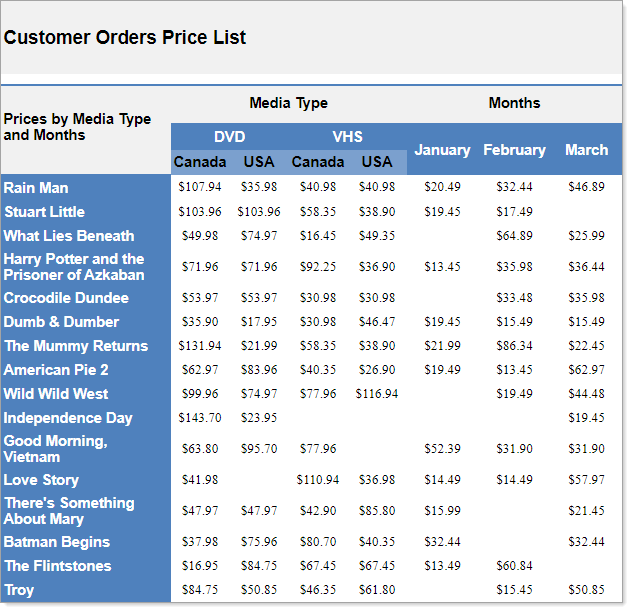
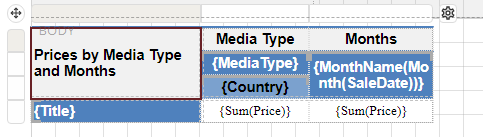
After you complete this tutorial, you will have a report that looks similar to the following.
Add Groups
After creating the simple Pivot report, let us add two groups to the MediaType column group - an adjacent group and a child group.
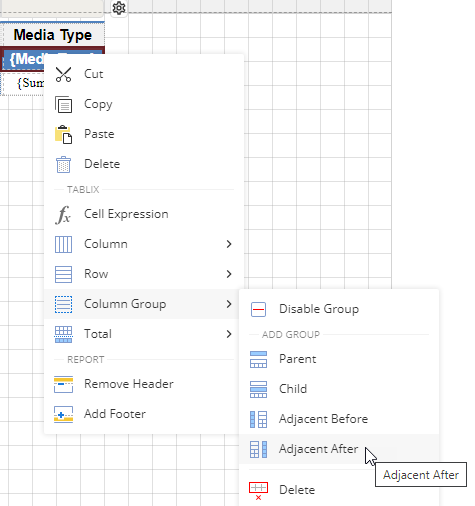
To add an adjacent group,
Right-click the MediaType column group area to view options in the context menu.
Go to Column Group and Select Adjacent-After.
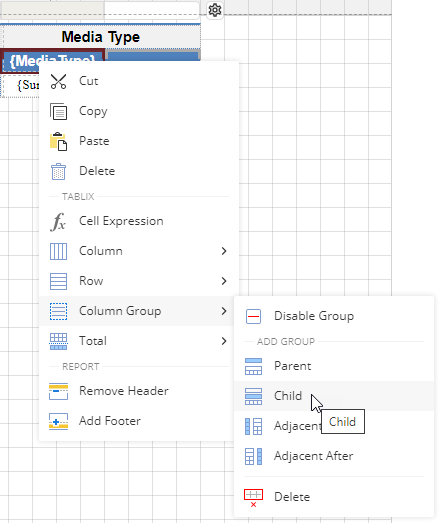
To add a child group,
Right-click the MediaType column group area to view options in the context menu.
Go to Column Group and select Child.
Now, the tablix looks similar to the following.
Bind Data to the Tablix Data Region
To add fields to the newly added groups,
Drag and drop the Country field on the child group area.
Drag and drop the SaleDate field on the group adjacent to MediaType column group.
To obtain the month value of sale date,
Select the SaleDate column group.
Go to the Properties pane and change the Value property to the following expression:
{MonthName(Month(SaleDate))}
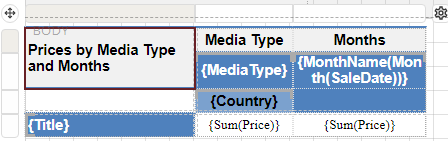
To display the month wise aggregate price,
Drag and drop the Price field onto the body of the tablix.
Select the body area containing Price field.
Go to Properties pane and change the Value property to the following expression:
{Sum(Price)}Now the tablix data region will look similar to the following.
Manage Data
Since the data in a tablix expands across both rows (vertically) and columns (horizontally), you need to add groups and filters to manage such a large amount of data.
To manage how the added group data is rendered across rows and columns,
From the Explorer
 , select the Tablix data region.
From the left pane of the designer, click the Group Editor icon
 to display row groups and column groups.
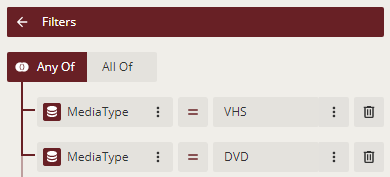
To limit the horizontal data in tablix, let us add filter to MediaType column group so that it displays only two types of media - VHS and DVD.
Select Tablix1_MediaType_Group column group and go to the Properties pane.
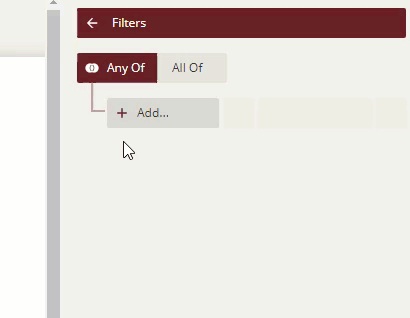
In the Filters property, click + Add to specify the filter conditions.
Select the Any of, that is the OR, logical operator.
Click the + Add to display the fields and select the MediaType field and enter the filter value as 'VHS'.
Again, click the + Add to display the fields and select the MediaType field and enter the filter value as 'DVD'.
To display the month names once for SaleDate column group,
Select Tablix1_SaleDate1_Group column group and go to the Properties pane.
In the Group Expressions property, click Show Items and then select Add Item.
Enter the following expression:
{MonthName(Month(SaleDate))}
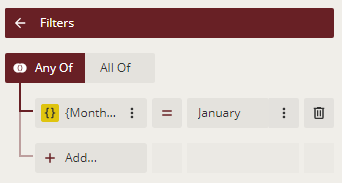
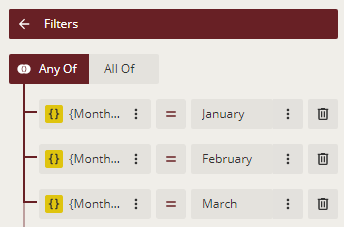
To display only the first three months of the year, that is, January, February, and March.
Select Tablix1_SaleDate1_Group column group and go to the Properties pane.
In the Filters property, click + Add to specify the filter conditions.
Select the Any of, that is the OR, logical operator.
Click the + Add to display the fields and select Expression.
In the Expression Editor, enter the following expression:
{MonthName(Month(SaleDate))}Enter its corresponding filter value as 'January'.
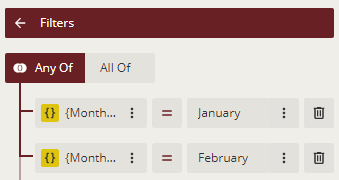
Again, click the + Add to enter the following expression in the Expression Editor:
{MonthName(Month(SaleDate))}Then, enter its corresponding filter value as 'February'.
Now, for the last time, click the + Add to enter the following expression in the Expression Editor:
{MonthName(Month(SaleDate))}Then, set the filter value as 'March'.
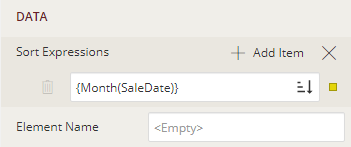
To sort the month names in the increasing order of month numbers,
Select Tablix1_SaleDate1_Group column group and go to the Properties pane.
Go to Sort Expressions property, click Show Items, and then click Add Item.
Then, enter the following expression in the added item:
{Month(SaleDate)}Set the sort order to ascending (default).
Improve the Layout of Tablix Data Region
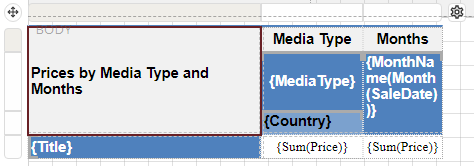
To manage the text and labels that appear in cells,
Right-click the cell with text 'Media Type' to view options in the context menu.
Select Split Cells. Now we have a new cell adjacent to cell with 'Media Type'.
In the new cell, enter the text 'Months' to give label to the SaleDate column group.
To merge cells with adjacent empty cells,
Select the SaleDate column group and the empty cell below it, right-click, go to Cells and select Merge Cells.
Similarly, merge the corner area (top left area) of tablix with the empty cell below it.
In the above merged cell, change the text to 'Prices by Media Type and Months'.
Customize the Appearance of the Pivot Report
Note: You may need to resize and reposition the controls on the report to accommodate data, and for a cleaner look.
Customize the body area and group area of the Tablix data region using the TEXT - Text Align (Left, Right, Center, and Justify.) and TEXT - Vertical Text Align (Top, Middle, or Bottom) properties. By default, these properties are set to General and Top.
Note that background color and the font weight properties are already applied, same as the Media Type label.
Preview and Save Report
Click Preview to view your report in the final output.
Exit the preview mode by clicking Back on the left side of the designer.
Click Save to open the Save dialog box. Enter the report name and click Save Report.