- Getting Started
- Administration Guide
-
User Guide
- An Introduction to Wyn Enterprise
- Document Portal for End Users
- Data Governance and Modeling
- Working with Resources
- Working with Reports
- Working with Dashboards
- View and Manage Documents
- Understanding Wyn Analytical Expressions
- Section 508 Compliance
- Subscribe to RSS Feed for Wyn Builds Site
- Developer Guide
Create Parameterized Report
Wyn Enterprise allows you to use parameters to filter or add the data to display in reports at run time. You can either prompt users for parameters so that they control the output, or supply the parameters behind the scenes.
What You Will Learn
This tutorial guides you through the steps to create a parameterized report in Wyn Enterprise Report Designer.
Note: This tutorial uses sample SalesByRegion data set.
After you complete this tutorial, you will have a report that looks similar to the following.
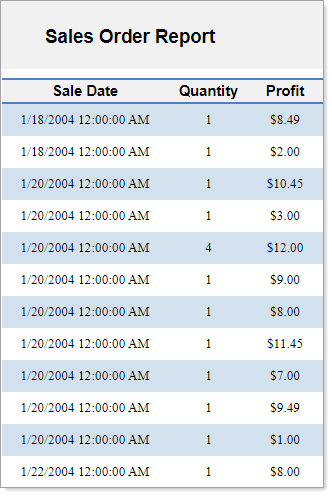
(Parameter1 = Canada West and Parameter2 = 1004)
Create Databound Table
To create a databound table,
Go to the Data tab and click the drop-down next to the SalesByRegion data set. You can now see all the available fields in the data set.
Enable Select Fields... and then choose the desired fields required in the table.
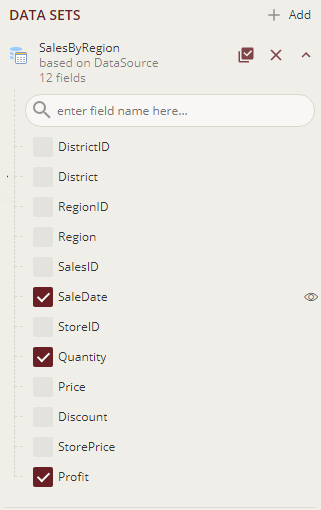
Drag-drop the selected fields onto the design area. A table with its column bound to the fields is created. You can see the Header row and Details row of the table are automatically filled with the data.
Alternatively, you can first drag-drop the Table data region
 onto the design area of the report and then populate the data by dragging and dropping the fields onto the details row.
Note: The Data Set Name property of the table is automatically set to SalesByRegion.
Add Parameter to the Report
Let us add two parameters that would act as filters for data retrieved from the data source, one would be passed as a filter for the region, and the other to filter the data according to store ids.
To add a report parameter that filters the data according to the region,
From the top right corner of Report Designer, click the Data icon
 .
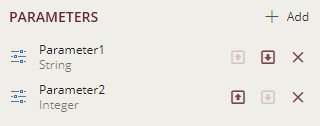
.Click Add next to Parameters. A parameter named Parameter1 is added.
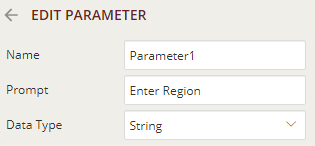
Click Parameter1 to edit parameter properties.
Set Data Type property to String and Prompt property to 'Enter Region'.
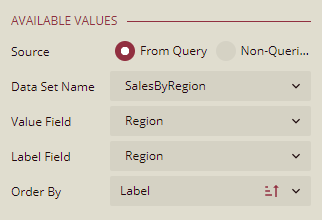
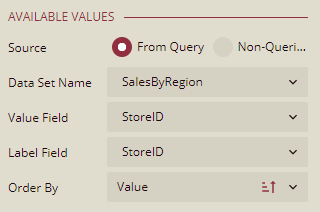
Under the Available Values section, select the Source as From Query and set the following properties as shown below.
You can sort the parameter values using the Order By property. The Order By dropdown list has the following options as shown below.
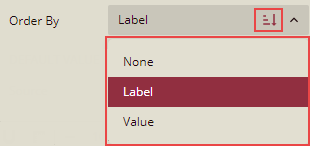
None: When this option is selected, then the parameter values are sorted in the order determined by a data set query.
Label: When this option is selected, then the parameter values are ordered according to Label Field specified above.
Value: When this option is selected, then the parameter values are ordered according to Value Field specified above.
Sort Direction
 ( Ascending / Descending) toggle button: You can use this toggle button to add the sort direction for Label Field / Value Field.
Note: The values in the Parameter list on the preview page, will be sorted based on the value selected from the Order By property and the Sort Direction.
To add a parameter that filters the data according to the store id,
From the top right corner of Report Designer, click the Data icon
.Click Add next to Parameters. A parameter named Parameter2 is added.
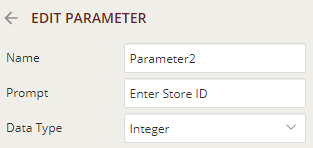
Click Parameter2 to edit parameter properties.
Set Data Type property to Integer and Prompt property to 'Enter Store ID'.
Under the Available Values section, select the Source as From Query and set the following properties as shown below.
You can sort the parameter values using the Order By property as explained above in step 5.
Manage Data in the Report
To control the amount of data rendered in the report, we can add filters to the Table data region. In our report, we will be adding two filters such that the report renders data according to the user input in the parameters (Parameter1 and Parameter2).
Select the table and go to Properties pane.
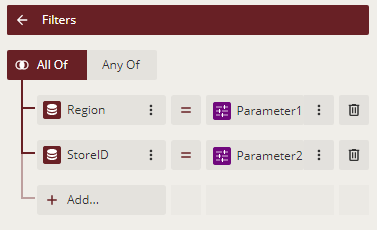
In the Filters property, click + Add to specify the filter conditions.
Select the All Of, that is the AND, logical operator.
Click the + Add to display the fields and then select the Region field.
Set the corresponding filter value for the Region field to 'Parameter1'.
In the same way, set 'Parameter2' as the filter value for the StoreID field. The Filters property should now look like the following.
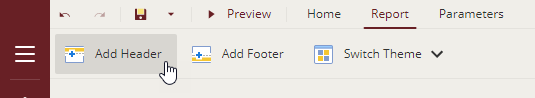
Add Page Header
Go to the Report tab on top of the designer and select Add Header option.
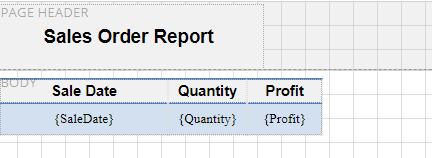
Drag and drop a TextBox control
 in the page header area.
Click inside the text box and enter the text 'Sales Order Report'.
Customize the Appearance of Parameterized Report
Note: You may need to resize and reposition the controls on the report to accommodate data, and for a cleaner look.
Set the BACKGROUND - Color property for the page header and header row of the table to '#f1f1f1'.
Align the text in the textboxes using the TEXT - Text Align (Left, Right, Center, and Justify.) and TEXT - Vertical Text Align (Top, Middle, or Bottom) properties. By default, these properties are set to General and Top.
Set the font size for the text in the page header to 14pt using the TEXT - Font Size property.
Specify the border properties for the textboxes in the table using the BORDER - Width, Border - Style, and BORDER - Color properties. Set the border values to '0.25pt', 'Solid', and '#f1f1f1', respectively.
Change the TEXT - Format property for the Profit field to 'Currency'. This property displays the profit values in currency format.
Preview and Save Report
Click Preview to view your report in the final output. You will be prompted to enter two parameters - select the region name and the store id for which you want to view the report, and again click Preview.
Note: The values in the Parameter list appear as sorted based on the value selected from the Order By property and the Sort Direction( Ascending/Descending) as specified under the Available Values section on the From Query Source, while editing the Parameters.
Exit the preview mode by clicking Back on the left side of the designer.
Click Save to open the Save dialog box. Enter the report name as 'Detail Report' and click Save Report.