- Getting Started
- Administration Guide
-
User Guide
- An Introduction to Wyn Enterprise
- Document Portal for End Users
- Data Governance and Modeling
- Working with Resources
- Working with Reports
- Working with Dashboards
- View and Manage Documents
- Understanding Wyn Analytical Expressions
- Section 508 Compliance
- Subscribe to RSS Feed for Wyn Builds Site
- Developer Guide
Master-Detail Report using Groups
A master detail report can be created by grouping the details in the Details row of Table data region. For each associated row from the master record, the grouped details are repeated.
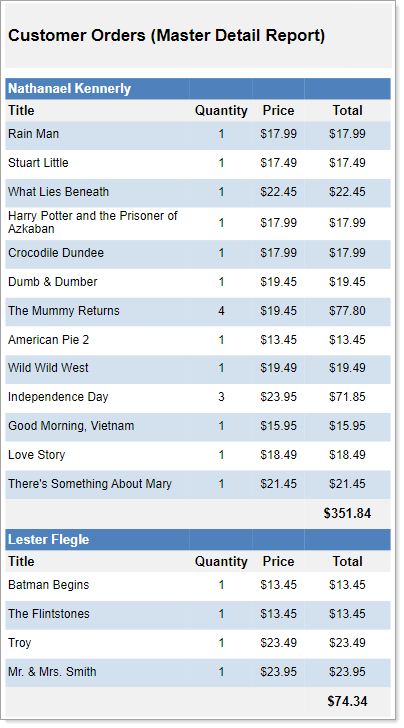
Consider that you want to create a report that shows titles and corresponding values of quantity, price, and total price. You also want these details to be categorized according to the customer name. In this case, the details go to the details row of the table, and these details are repeated for each customer.
What You Will Learn
This tutorial guides you through the steps to create a master detail report by grouping a part of data in a Table data region.
Note: This tutorial uses a sample CustomerOrders data set.
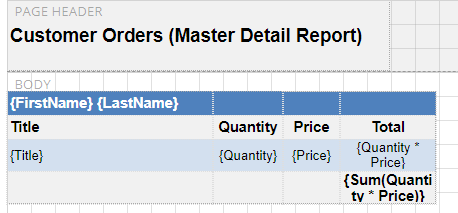
After you complete this tutorial, you will have a report that looks similar to the following.
Create Databound Table
To create a databound table,
Go to the Data tab and click the drop-down next to the CustomerOrders data set. You can now see all the available fields in the data set.
Enable Select Fields... and then choose the desired fields required in the table.
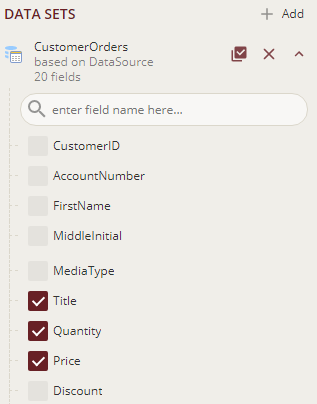
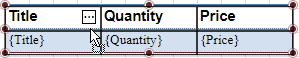
Drag-drop the selected fields onto the design area. A table with its column bound to the fields is created. You can see the Header row and Details row of the table are automatically filled with the data.
Alternatively, you can first drag-drop the Table data region
 onto the design area of the report and then populate the data by dragging and dropping the fields onto the details row.
We will now add one more column to the table that will display the total field. For this, you need to click inside the table to display the column handle, and then click the plus sign.
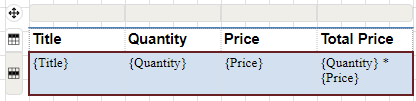
We will now have a table with two rows and four columns, respectively.
Select the newly added column of the details row and enter the following expression in the Value field,
{Quantity} * {Price}Then lastly, select the textbox above the details row for the total field and enter the text 'Total Price' in it.
The table is finally created and it would look similar to below.
Note: The Data Set Name property of the table is automatically set to CustomerOrders data set.
Add Groups and Bind data to the Groups in Table Data Region
Let us add more meaning to the report by adding groups.
We will group the details according to the customer names, and will have the column labels repeated for each group. So, the master part of the table will consist of first name and last name of the customer along with the static text for the labels in the detail part. To do so, let us add two row groups, as described in the following sections.
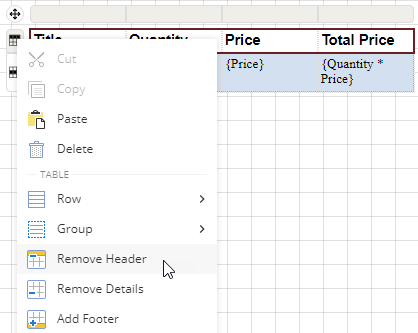
First of all, delete the Header row of the table (these are not required in our report),
Click inside the Table data region to make the row handle appear.
Right-click the row handle and select Remove Header to remove the header row from the table.
To add a group that contains the customer name,
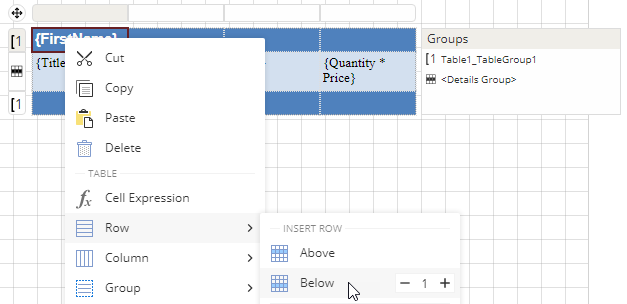
Right-click any text box (cell) in the details row of the table to view options in the context menu.
Go to Group and select Insert Group.
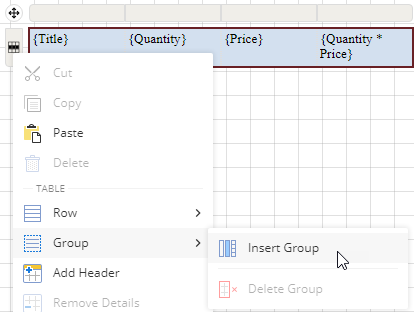
This adds a row group above and below the details row.
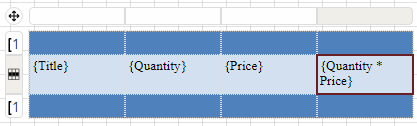
Select the first text box of the added row group and set its value as following,
{FirstName} {LastName}Right-click a text box in the added row group (above the details row) to view options in the context menu.
Go to Row and select Below to add a new row for the header labels.
Now your table looks similar to the following.
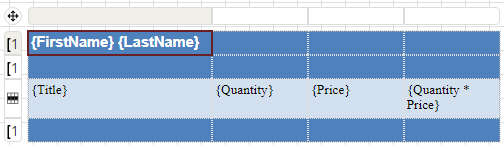
Note: The table groups are displayed in the adorner on the right side of the Table data region.
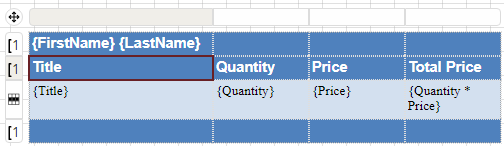
In the row group above the details row, enter the labels for the details as shown.
To group the details for each customer,
From the Explorer
 , select the Table data region.
From the adorner on the right side of the Table data region, select Table1_TableGroup1 row group, and go to the Properties pane.
In the Group Expressions property, click Show Items and then select Add Item.
Click the radio button to display the fields and select the CustomerID field.
To add page breaks and a new page in data groups
Page Break: You can select from these options to decide where to insert a page break in relation to the group. It has the following options.
• None: Inserts no page break.
• Start: Inserts a page break before the group.
• End: Inserts a page break after the group.
• StartAndEnd: Inserts a page break before and after the group.
• Between: Inserts a page break between groups (at the end of a current group and the beginning of the next group).
New Page: You can control page breaks in data groups of data regions by using the New Page property for data regions and its combination with the Page Break properties. It has the following options.
• Next: A default value that makes a new group start from the immediate next page of the report.
• Odd: A new group starts from the next odd page of the report.
• Even: A new group starts from the next even page of the report.
Example: We are using a report that has a table group with the following properties:
• Page Break - End
• New Page - Even
As a result, the report renders 10 pages, a page break is added after a table, and a new page is added after the table at even pages.
To add page breaks and a new page in the details group
You can group the table data by grouping the Details row without adding a group. The Detail Grouping groups the data in such a way that only one row per distinct grouping value or expression is displayed for each row of data in the Details row. Also, it does not add a Group Header and Group Footer. Detail grouping is useful when you do not want the values to repeat within the details as many times as they are present in the data source. You can add the page break in the details group.
Page Break: Select from these options to decide where to insert a page break in relation to the group.
None: Inserts no page break.
Start: Inserts a page break before the group.
End: Inserts a page break after the group.
StartAndEnd: Inserts a page break before and after the group.
Between: Inserts a page break between groups (at the end of a current group and the beginning of the next group).
NewPage:
Next: A default value that makes a new group start from the immediate next page of the report.
Odd: A new group starts from the next odd page of the report.
Even: A new group starts from the next even page of the report.
Example: We are using a report that has a details group with the following properties:
• Page Break - Start
• New Page - Even
As a result, the report renders a page break at the start, and then the details about the countries at even pages.
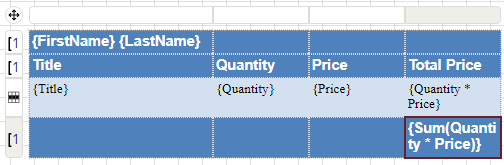
To obtain the sum of prices for each group,
Select the bottom-right-most cell of the table and enter the following expression in the Value field,
{Sum(Quantity * Price)}The table will now look as shown below.
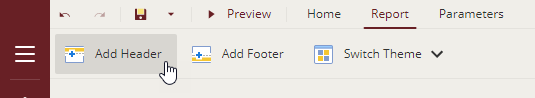
Add Page Header
Go to the Report tab on top of the designer and select Add Header option.
Drag and drop a TextBox control
 in the page header area.
Click inside the text box and enter the text 'Customer Orders (Master Detail Report)'.
Customize the Appearance of Report
Note: You may need to resize and reposition the controls on the report to accommodate data, and for a cleaner look.
Set the BACKGROUND - Color property for the page header of the report to '#f1f1f1'.
Align the text in the textboxes using the TEXT - Text Align (Left, Right, Center, and Justify.) and TEXT - Vertical Text Align (Top, Middle, or Bottom) properties. By default, these properties are set to General and Top.
Set the font size for the text in the page header to '14pt' using the TEXT - Font Size property.
Specify the border properties for the textboxes in the table using the BORDER - Width, Border - Style, and BORDER - Color properties. Set the border values to '0.25pt', 'Solid', and '#f1f1f1', respectively.
Change the TEXT - Format property for the Price field to 'Currency'. This property displays the price values in currency format.
Preview and Save Report
Click Preview to view your report in the final output.
Exit the preview mode by clicking Back on the top left side of the designer.
Click Save to open the Save dialog box. Enter the report name and click Save Report.