- Getting Started
- Administration Guide
- User Guide
- Developer Guide
Create Report
Wyn Enterprise provides a robust reporting environment for enterprise reports and ad hoc reports. With the help of Wyn reporting features, you can quickly create meaningful and beautiful reports with a lot of ease. The report designer also offers a huge variety of configuration options for the reporting controls that can be used to enhance the report appearance like the background color, font color, etc., or increase the report functionalities like embedding links to jump to another document, using data filters to display only specific information, and so on.
In this example, we will create a report in Wyn Enterprise and learn some basic concepts like sorting, merging, grouping, and working with parameters:
Create Report
Create Report Layout
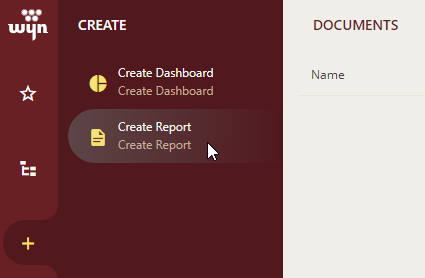
On the Document Portal, go to Create (+) > Create Report.
Select a template of the report. You can choose a Blank RDL Report, a Blank Page Report, or any other report as template from Categories.
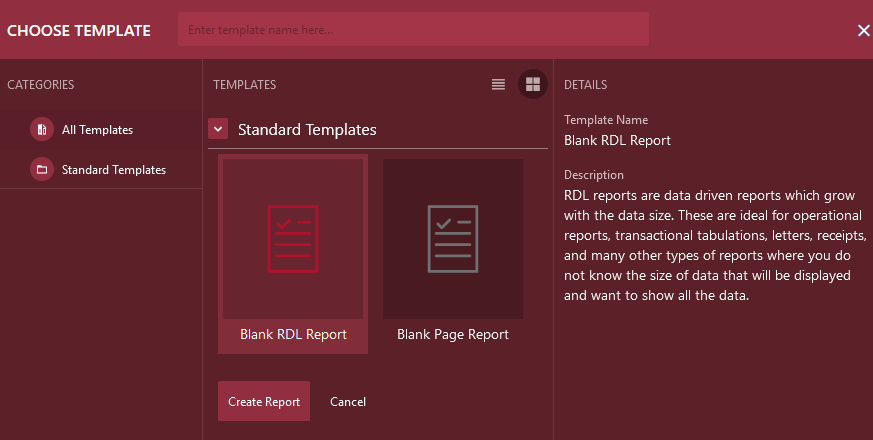
Click Create Report.
Pick a Dataset
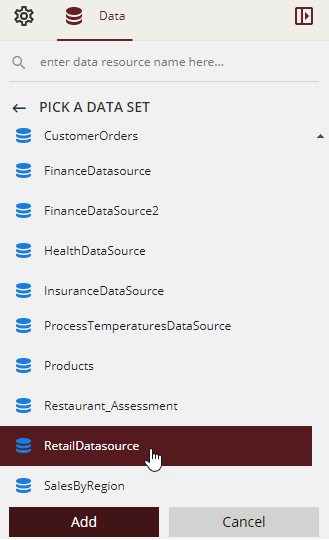
From the Data Binding tab on the right, select RetailDatasource dataset, which is already available to us, and click Add.
This opens the Edit Dataset dialog with a default query.
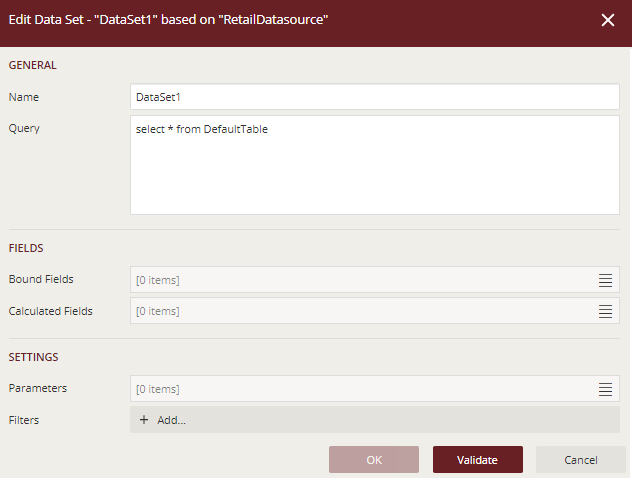
Click Validate and then OK.
Create Databound Table
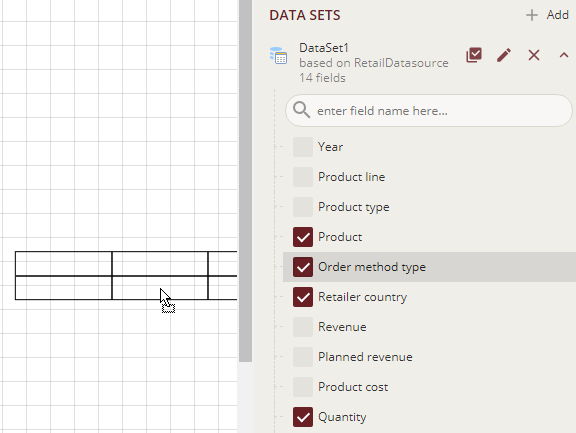
To view fields in the data set, click the drop-down next to the RetailDatasource dataset and enable Select Fields....
Select the fields required in the table and drag-drop onto the design area.
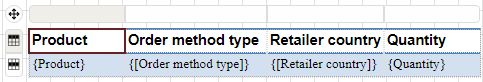
A table with its columns bound to the fields is created. The Header row above the details row is automatically filled with labels.
Alternatively, you can first drag-drop the Table data region onto the design area of the report and then populate the data by dragging and dropping the fields onto the details row.
Re-arrange the columns in the table such that it looks like as shown below.
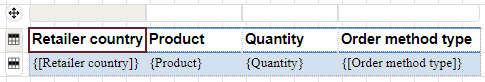
We will now add a column after the Product field to display the total price for the products. Click inside the table to display the column handle, and then click the plus sign. It will add a new column to the table.
Select the details row of the newly added column and set the Value field to the following expression:
{[Unit price] * Quantity}Note: You can change the display format for the total price using the TEXT - Format property. In this example, the TEXT - Format property for the total price is set to 'Currency'.
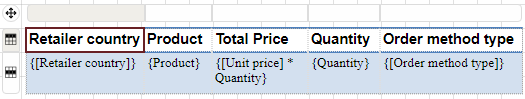
Then, select the header row of the newly added column and enter the text 'Total Price'.
The table will now look as shown below.
Preview
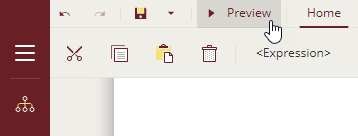
Click Preview to view the final output of your report.
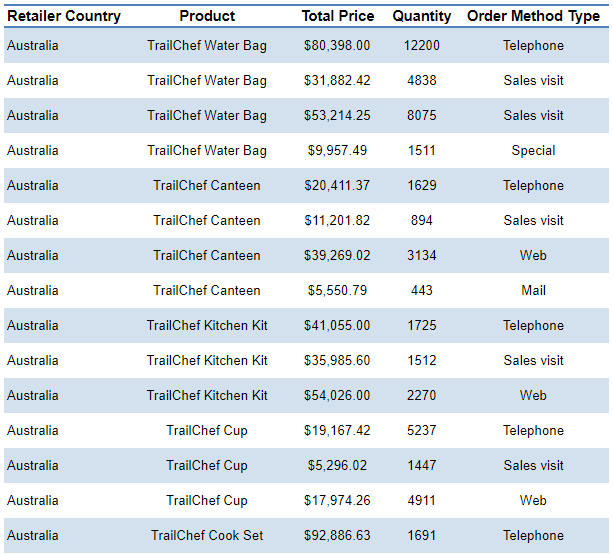
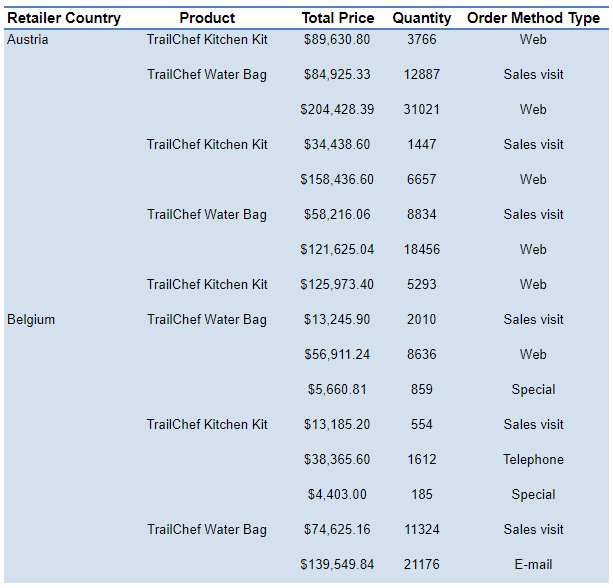
The output of your report will look similar to the following.
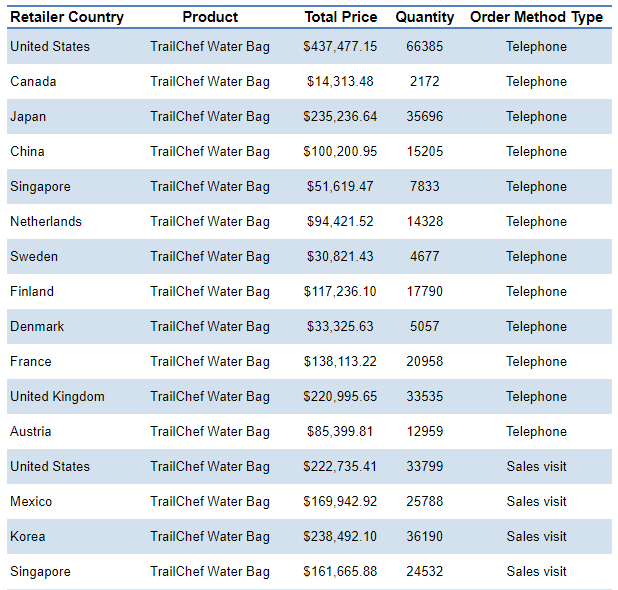
Exit the preview mode by clicking Back on the left side of the designer.
Sort
Let us sort the table data region in alphabetical order of retailer country.
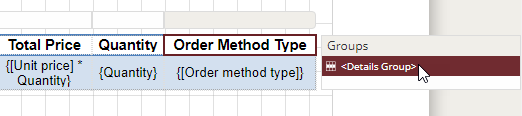
From the adorner on the right side of the table, select Details Group.
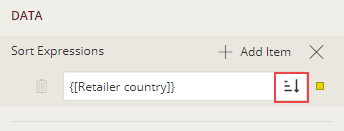
Go to the Sort Expressions property, click Show Items, and then select Add Item.
Click the radio button to display the fields and select the 'Retailer Country' field. By default, the sort order is ascending. You can change the sort order to descending by clicking the descending icon.
Preview the report.
Auto Merge
Data in table or tablix data regions can be merged using the AutoMergeMode property. The property provides three options - Never, Always, and Restricted. The detail cells with the same data values and with AutoMergeMode property set to:
Never: are not merged.
Always: are merged.
Restricted: are merged only if the corresponding cells in previous columns are similarly merged.
Let us merge the detail cells for similar products for the corresponding similar retailer country.
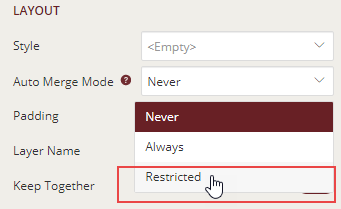
Select the Product textbox in the Details Group row.
Go to the Properties pane and set AutoMergeMode property to 'Restricted'. This merges the cells in the Product column with similar products, provided the country is the same.
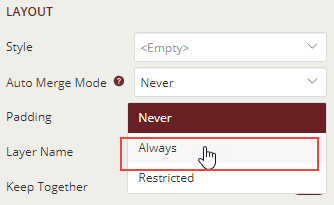
Similarly, select Retailer Country textbox in the Details Group row and set its AutoMergeMode property to 'Always'.
Preview the report.
Group
Let us apply grouping to the table to view the details year-wise. We will use the table with sorting applied on the Retailer Country.
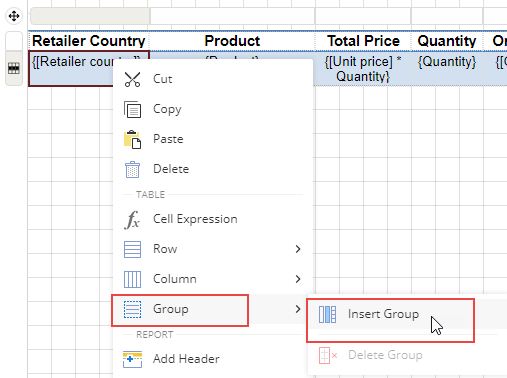
Right-click the Table data region to view options in the context menu.
Go to Group and Insert Groups.
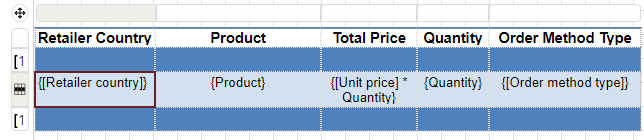
This will add a row group above and below the details row of the table.
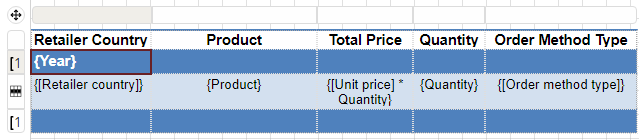
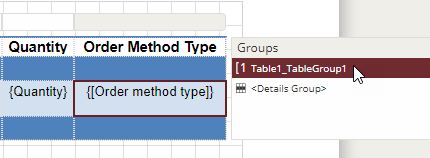
Select the first text box of the added row group and set its value as following,
{Year}The table will now look as follows.
Now, from the adorner on the right side of the Table data region, select Table1_TableGroup1 row group, and go to the Properties pane.
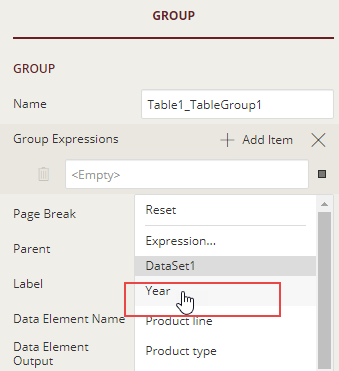
In the Group Expressions property, click Show Items and then select Add Item.
Click the radio button to display the fields and select the Year field.
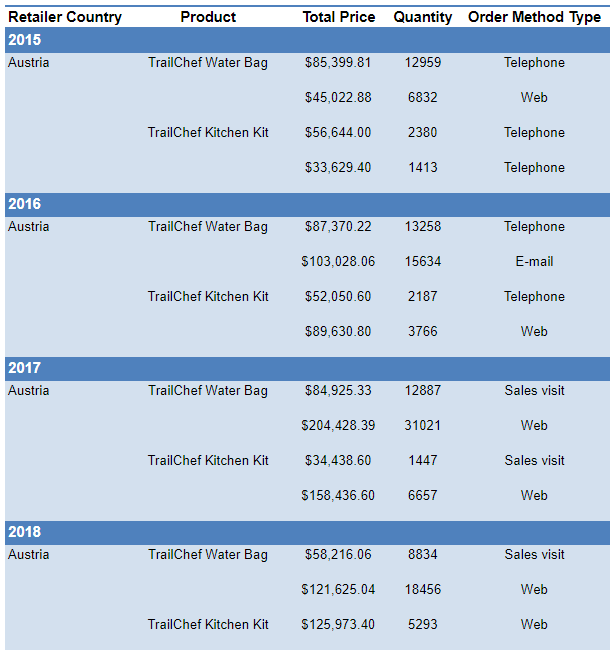
Preview the report. It will look similar to the following.
Add Parameter
Let us add a parameter that prompts the user to select multiple values. The selected parameters will act as a filter for data displayed in the table.
To add a report parameter that filters the data according to the order method,
From the top right corner of Designer, click the Data icon.
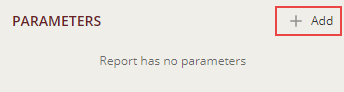
Click Add next to Parameters. A parameter named 'Parameter1' is added.
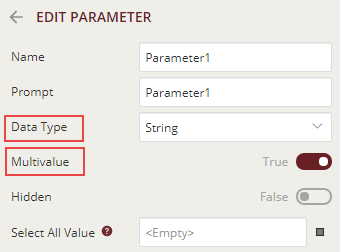
Click Parameter1 to edit parameter properties.
First, set the Data Type property to String and then the Multivalue property to True. The parameter properties will now look as shown.
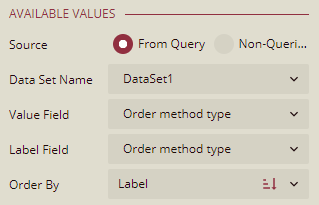
Under the Available Values section, select the Source as From Query and set the Data Set Name property to the added data set, Value Field property to 'Order method type', and Label Field property to 'Order method type'.
You can sort the parameter values using the Order By property. The Order By dropdown list has the following options as shown below.
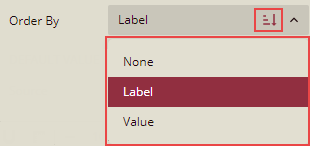
None: When this option is selected, then the parameter values are sorted in the order determined by a data set query.
Label: When this option is selected, then the parameter values are ordered according to Label Field specified above.
Value: When this option is selected, then the parameter values are ordered according to Value Field specified above.
Sort Direction ![]() ( Ascending / Descending) toggle button: You can use this toggle button to add the sort direction for Label Field / Value Field.
( Ascending / Descending) toggle button: You can use this toggle button to add the sort direction for Label Field / Value Field.
The multivalue parameter is now added.
To add a filter that renders data according to the user input in the parameter (Parameter1),
Select the table and go to the Properties pane.
Select the Filters property and click Edit.
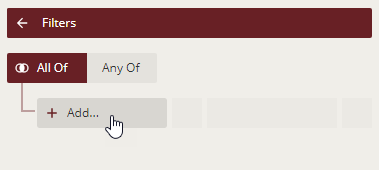
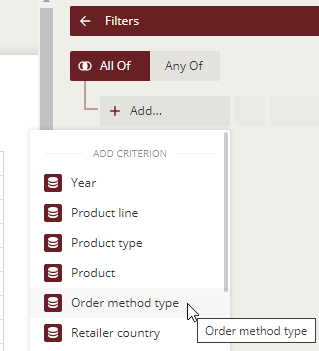
In the Filters properties, click + Add to specify the filter conditions.
Click the radio button next to Filter Expression to display the fields and select 'Order method type'.
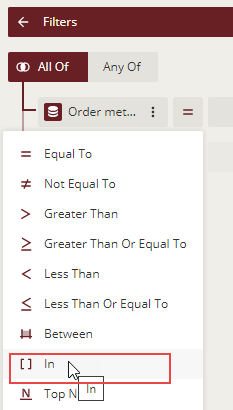
Click the drop-down next to Operator and select 'In'.
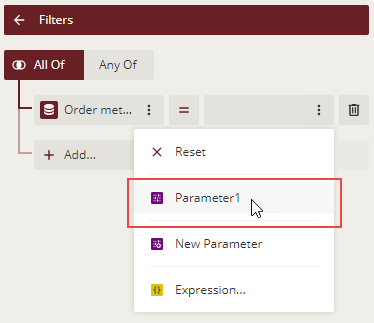
Click the radio button next to Filter Values and select 'Parameter1' from the list.
The filters properties should now look as below.
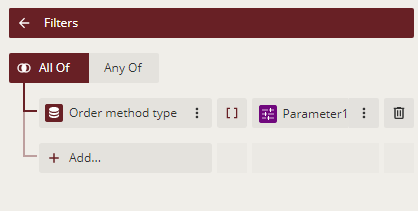
The filter on the table data region is now added.
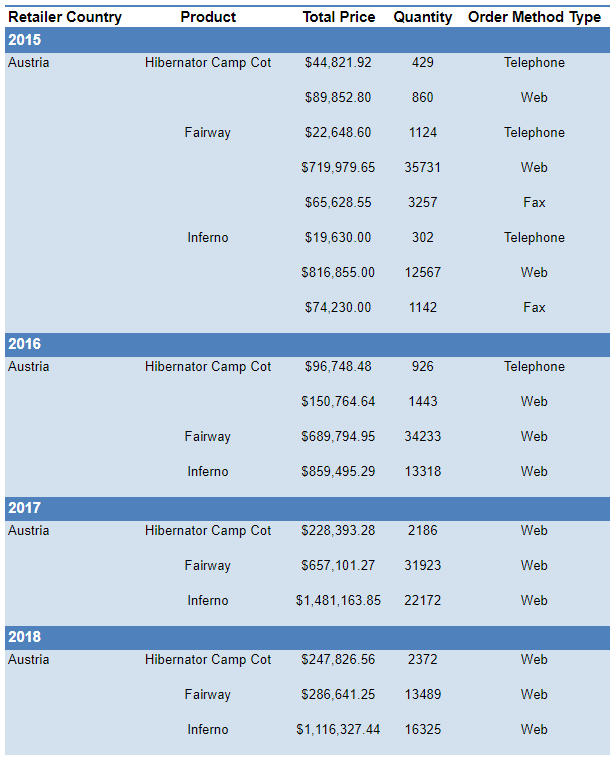
Preview the report to view the final output.
The following image displays the report with order method types (parameters) selected as Telephone, Web, and Fax.
See Using Report Designer for creating scenario-based reports.
Note: The values in the Parameter list on the preview page, will appear as sorted based on the value selected from the Order By property and the Sort Direction.
Save Report
Finally, click the Save button on the Menu Bar to save the report. Enter the report name in the Save (As) dialog box, and then again click the Save button. By default, the report is saved under the 'No Category' section of the Document Portal.
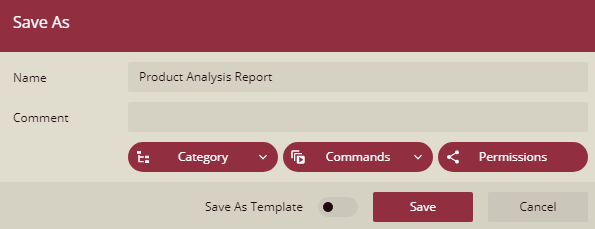
You can also do the following things when saving the report.
Comment - Add comments for additional information.
Category - Assign a category to the report that makes it easier to navigate on the portal. This option is visible only when the Allow user to set categories property is set to True in the Admin portal->Configuration->WynReports Settings->Designer Settings, under Save As Dialog section. For more information, please see the Assign Categories article.
Commands -Manage the commands that appear on the toolbar when you preview a report. For example, Navigation, Refresh, Refresh Cache, History, Mouse Mode, Zoom, Full Screen, etc.
Permissions - Select the role/organization with whom you want to share the report and then assign the role/organization the desired permissions to read, read or write, execute, or fully control the report.
In case, the selected role/organization does not have sufficient permissions on the referenced document to perform the action. You can apply the minimum needed permissions to make sure users can preview the report normally. For more information, please see the Share a Document article.
Save As Template - Choose whether to save the report as a template and later use it as the basis for the new report. This option is visible only when the Allow user to save report as template property is set to True in the Admin portal->Configuration Settings->WynReports Settings->Designer Settings, under Save As Dialog section. For more information, see the Create Custom Report Template article.