- Getting Started
- Administration Guide
- User Guide
- Developer Guide
Monitor Data with Alerts
Data monitoring is used to track the important key metrics in a dashboard. The defined threshold conditions, if fulfilled, trigger an alert through email, API, Slack, and MS Teams regarding the latest updates. This helps reduce the probability of potential risks in organizations and enhances their overall system efficiency.
Here's a quick video on the Wyn Alerts feature for dashboards to monitor your data.
For example, a manufacturer can monitor his company's real-time data in a dashboard to track the machines' statuses. If there is any sudden machine failure or breakdown, an alert would be triggered to the manufacturer notifying about the machine's status. This way, the manufacturer can take necessary actions to restore the machine at the earliest to reduce the risk of lost production.
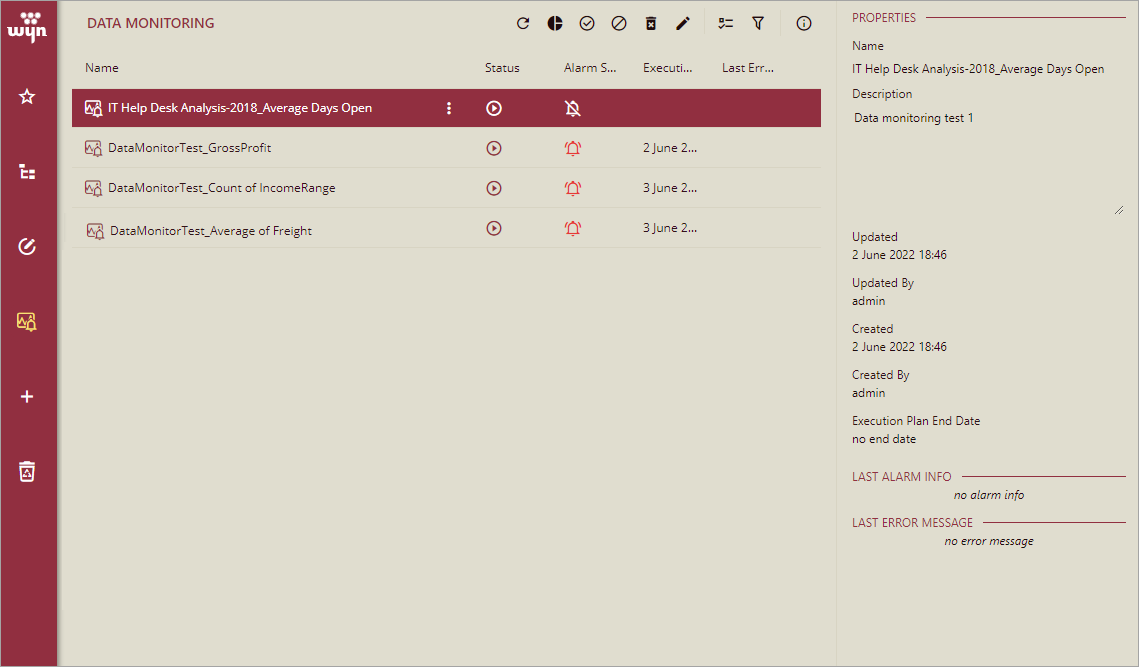
It is the Data Monitoring tab where you can view all the necessary information related to data monitoring such as name, alarm status, execution time, and last error time.
Name: The name of the data monitoring item.
Status: The status of the data monitoring item, which can be running, disabled, or failed.
Alarm Status: The alarm status of the previously executed data monitoring, which can either be alarm or no alarm. If no alarm was triggered in the previous execution, the alarm status is set to no alarm.
Execution Time: It shows the time when data monitoring was last executed.
Last Error Time: It shows the time when data monitoring faced an error during its execution. If no error occurred, this is left blank.
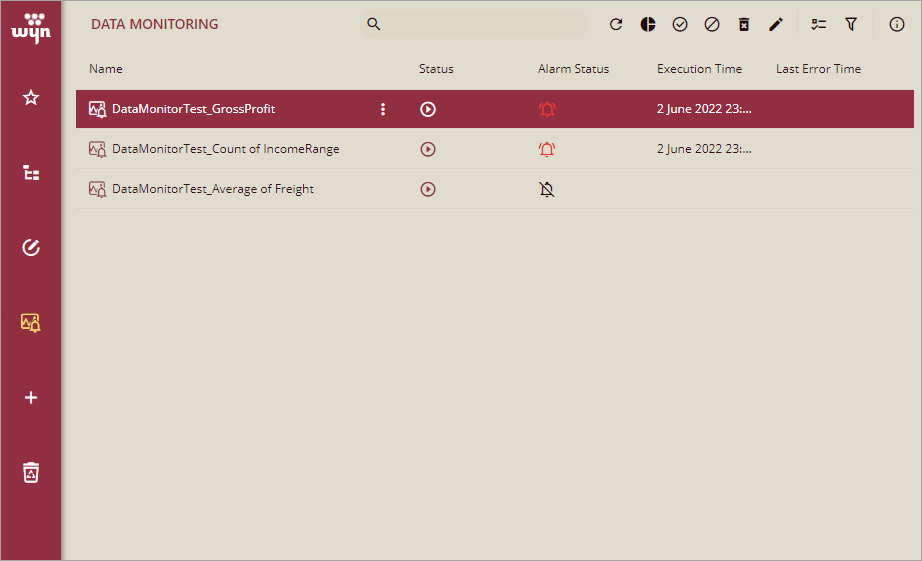
This tab lets you edit, enable or disable, rename and delete a data monitoring item, and view the related dashboard in the new window.
Note: Please contact Wyn Enterprise Sales to enable the data monitoring feature in Wyn Enterprise. By default, this feature is disabled.
Salient Points
Here are a few things to know about data monitoring in Wyn Enterprise.
Monitor any measure in the dashboard, including measures created through analytical expressions and quick functions.
Only a user role with the Create Data Monitoring permission can configure the data monitoring settings in a dashboard, and view the corresponding details on the Data Monitoring tab.
Configure Data Monitoring and Alert Conditions
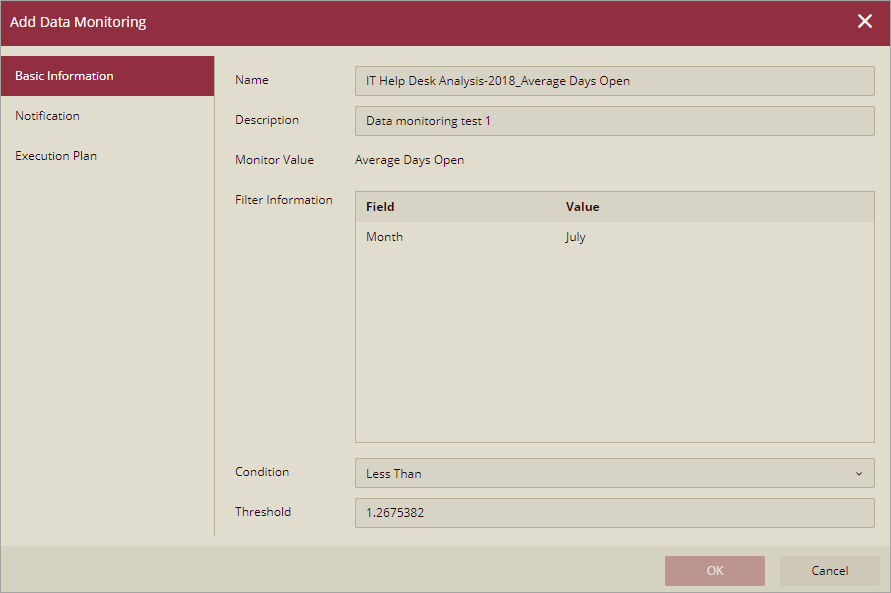
Basic Information Tab
This tab describes the basic details related to data monitoring and alert conditions.
Property | Description |
|---|---|
Name | Enter the name of the data monitoring. |
Description | Enter the description for data monitoring. |
Monitor Value | Shows the chosen measure you want to monitor. |
Filter Information | Displays the filtering information on the current monitoring data, such as linkage, global filter, slicer, cross filter, and selected dimension. |
Condition | Select the threshold operator from the list. An alert is triggered if the chosen measure passes a certain threshold. |
Threshold | Enter the threshold value. An alert is triggered if the chosen measure passes a certain threshold. |
* You cannot edit the monitor value or filter information in the dialog since these values are based on the chosen measure.
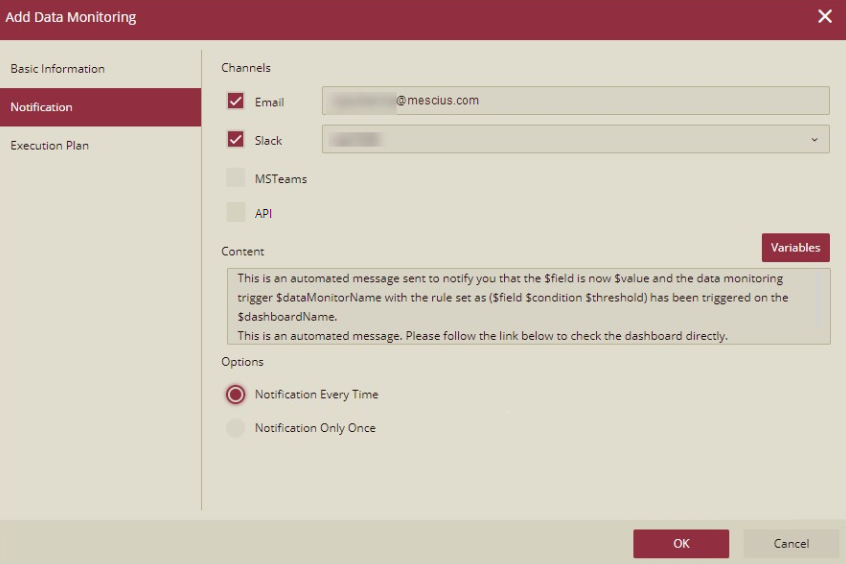
Notification Tab
This tab describes the details on how to trigger an alert notification if the measure meets a specified condition or reaches a certain threshold.
Property | Description |
|---|---|
Channels | Select the channel(s) through which you want to send an alert message. The supported channels are email, API, Slack, and MS Teams. Slack and MS Teams are available only if the admin user role has enabled their services on the Admin Portal. For more information, please visit this article. |
Content | Specify the body for the alert notification. It can include dashboard variables such as Dashboard ID, Dashboard Name, Dashboard URL, Monitoring Field Value, Condition, and Threshold. |
Options | Choose whether to notify every time or only once when the monitor value reaches the specified threshold. If you choose to notify every time, an alert is triggered each time the condition is met. If you choose to notify only once, an alert is triggered when the condition is met within the specified period. |
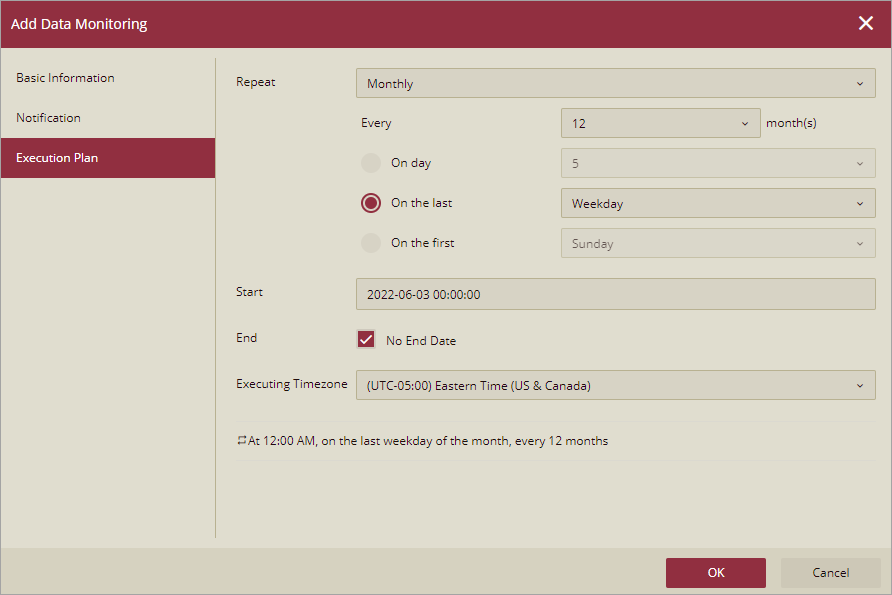
Execution Plan
This tab describes the options available to schedule the execution for data monitoring.
Property | Description |
|---|---|
Repeat | Choose whether to repeat the data monitoring on a daily or monthly basis and then specify its recurrence schedule. |
Start | Specify the date and time when the data monitoring will begin executing. |
End | Specify the date and time when the data monitoring will stop executing. |
Executing Timezone | Choose a suitable time zone from the list. |
To Create Data Monitoring
Follow the below steps to monitor a measure in a dashboard.
In the Dashboard Viewer, right-click a measure and choose Add to Data Monitoring.
In the Add to Data Monitoring dialog, open the Basic Information tab and enter the following details:
i. name of the data monitoring
ii. description of the data monitoring
iii. threshold condition for data monitoring
iv. threshold value for data monitoring
Navigate to the Notification tab and enter the following details:
i. suitable channel(s) to trigger alerts
ii. modify the body for the alert notification, if required
iii. choose whether to send the Notification Every Time or Notification Only Once
Then, navigate to the Execution Plan tab and enter the following details:
i. choose whether to repeat the execution on a daily or monthly basis and then set the recurrence schedule
ii. Specify the start date to begin executing the data monitoring
iii. Specify the end date to stop executing the data monitoring
Click OK to save the changes.
Close the dashboard and go to the Data Monitoring tab to view the added item. Click the Info Panel to view the data monitoring details related to alarm info, last alarm message, and execution plan start date.
To Edit Data Monitoring
Follow the below steps to modify the configuration details of a data monitoring item.
On the portal, navigate to the Data Monitoring tab and choose any monitoring item from the list.
Click More and choose Edit from the list.
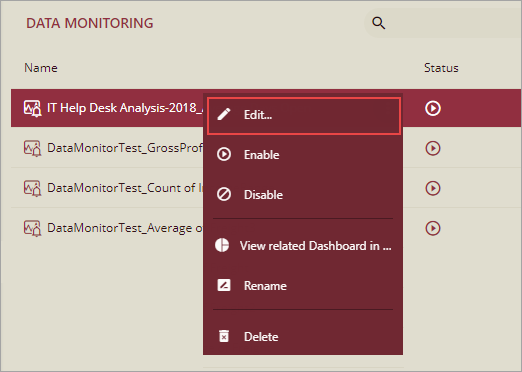
In the Data Monitoring dialog, change the configuration details based on your requirements.
Then, click OK to confirm changes.
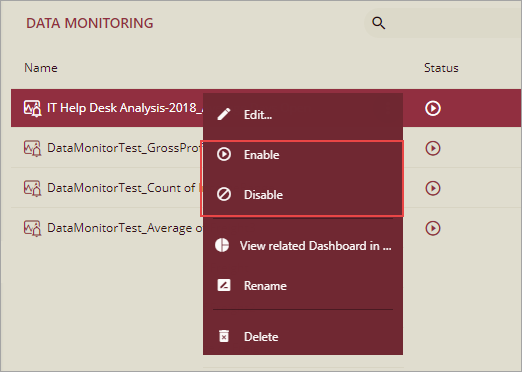
To Enable or Disable Data Monitoring
Follow the below steps to enable or disable data monitoring.
On the portal, navigate to the Data Monitoring tab and choose any monitoring item from the list.
Click More and select Enable or Disable from the list.
a. By enabling the data monitoring, you resume its execution.
b. By disabling the data monitoring, you stop its execution.
To Delete Data Monitoring
Follow the below steps to delete data monitoring.
On the portal, navigate to the Data Monitoring tab and choose any monitoring item from the list.
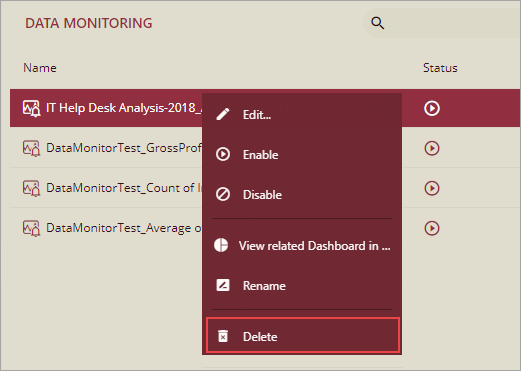
Click More and select Delete from the list.
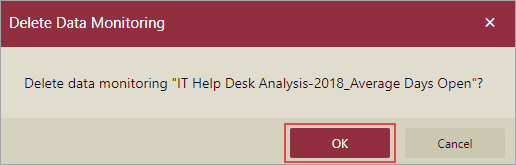
In the Delete Data Monitoring dialog, click OK to confirm.
Limitations
Data monitoring is not supported on scatter chart, table, and advanced chart scenarios.
The data monitoring item does not support the following operations, such as export, import, download, upload, duplicate, share, and assign to a category.
Information related to the data monitoring state is lost on the system restart, such as the last execution time, the last error message, and so on.
Data monitoring is not supported when previewing the dashboard by a creative designer.
If a role is revoked with the View Data Monitoring permission, it takes an hour to reflect the changes.
The data monitoring stores the query of the monitoring measure during its creation. After modifying or deleting the measure, the query cannot be modified automatically. So, it calculates the value according to the initial query, even if the chosen measure has changed.