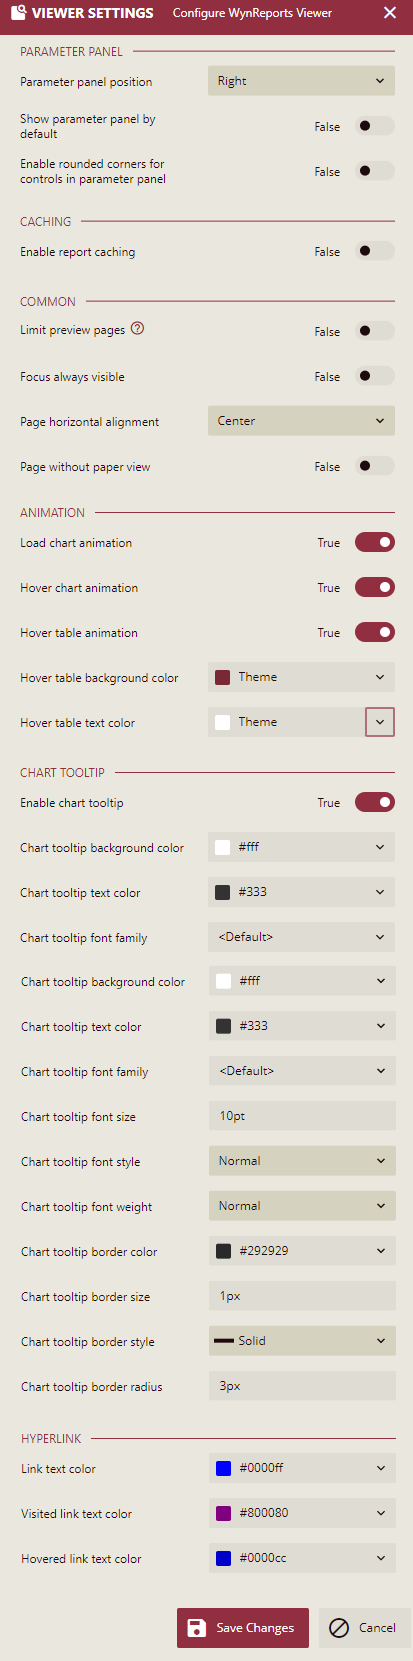
Viewer Settings
The Viewer Settings page lets you manage the parameter panel, limit the number of pages while previewing a report, set the focus of the report viewer, change the horizontal alignment of a report page in the Viewer, choose paper view option to render a report, enable hover effect on tables or charts, control the load animation effect on charts, enable report caching options, and much more.
Parameter Panel
Parameter Panel Position
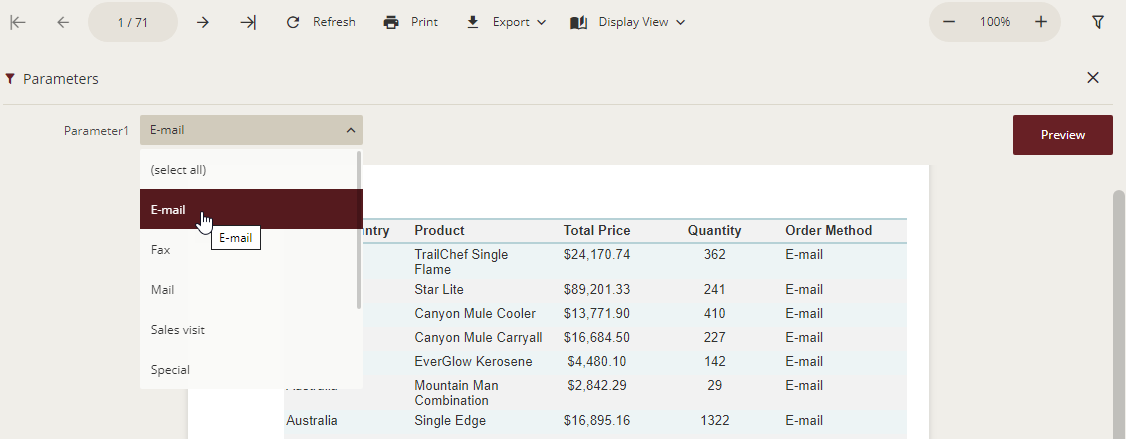
This lets you set the position of the parameter panel, which can be above or to the right of the report. On previewing the reports with parameters, the prompt panel appears according to the position set in this option.
The following image shows the parameter panel in the right position.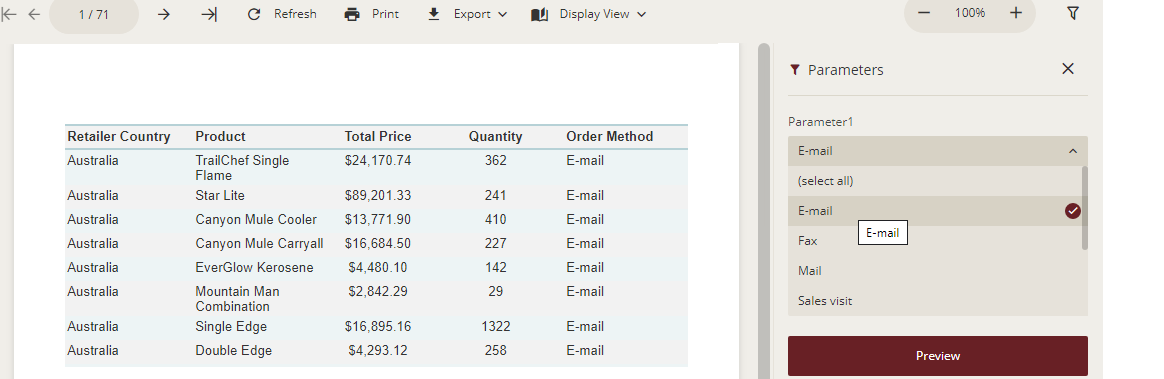
The following image shows the parameter panel in the top position.
Show Parameters Panel By Default
Set the option to True or False to control the default visibility of the parameter panel on previewing reports. This option is used to display the parameter panel by default on preview, even if the report consists of no parameters or if the parameters are set to default values. By default, this option is set to 'False'.
Enable Rounded Corners For Control In Parameter Panel
Can be set to true or false. It is set to true to view the parameter panel controls with rounded corners on previewing the report.
Caching
Enable Report Caching
Set the option to True or False to control the display of caching section in the Info panel for the reports on Resource portal and Document portal of Wyn Enterprise. You can enable report caching to shorten the time needed to retrieve a particular report.
Report caching is extremely beneficial for large reports with an infrequent change of data, and is a great technique to improve the performance of report rendering in Wyn Enterprise.
To enable report caching on the Resource portal or Document portal, set this property to True. On enabling this option, you can also configure several report caching options in the Info tab of the Resource portal or Document portal for the selected report, such as allow caching, caching, maximum caching age, and caching interval.
Note: The report cache refreshes when you change any parameter value, organizational context value, or user context value, used to run the report.
To disable report caching on the Resource portal or Document portal, set this property to False. In this case, the report uses the latest data from the database.
On disabling this option, no report caching options are available in the Info tab of the Resource portal or Document portal for the selected report.
For a more conceptual understanding of report caching, please see these articles - Enable Report Caching on Resource Portal and Enable Report Caching on Document Portal.
Default Cache Type
This option lets you specify the default cache type for reports once you enable report caching in the Admin portal. The 'Default Cache Type' option can be set to Preview or Full.
If you set this option to Preview, report caching is enabled only in the Wyn Report Viewer.
If you set this option to Full, report caching is enabled in both Wyn Report Viewer and report exports. For more information on report exports, please see this article.
The chosen value appears as the default value for the 'Cache' option in the Info panel of the Resource portal or Document portal.
Allow User to Change Cache Type
This option enables you to specify whether users can modify the cache type for the report in the Info panel of the Document or Resource portal. The 'Allow User to Change Cache Type' option is available only when 'Enable Report Caching' is set to True.
If you set this option to True, the users can change the cache type for the report in the Info panel of the Document or Resource portal for the selected report.
If you set this option to False, the 'Cache' option is not available in the Info panel of the Resource portal or Document portal.
Caching Expiry
Indicates the maximum time period (in numerals) required to keep the report cached. Once the specified time period expires, the report is removed from the cache. This option is available only when 'Enable Report Caching' is set to True.
The specified value appears as the default value for the 'Maximum Caching Age' option in the Info panel of the Resource portal or Document portal.
Caching Interval
Defines the unit (Hour, Day, Week, or Month) for the cache expiry time. After each time interval, the report is removed from the cache. This option is available only when 'Enable Report Caching' is set to True.
The specified value appears as the default value for the 'Caching Interval' option in the Info panel of the Resource portal or Document portal.
Allow User to Set Cache Expiry
This option enables you to specify whether users can modify the cache expiry of a report in the Info panel of the Document or Resource portal. The 'Allow User to Set Cache Expiry' option is available only when 'Enable Report Caching' is set to True.
If you set this option to True, the users can change the cache expiry time for the report in the Info panel of the Document or Resource portal.
If you set this option to False, the 'Maximum Caching Age' and 'Caching Interval' options are not available in the Info panel of the Resource portal or Document portal.
Common
Limit Preview Pages
Can be set to true or false, to limit the pages displayed on previewing a report.
Preview pages
Lets you specify the maximum number of pages that can be previewed in a report. This option is available only when 'Limit Preview Pages' is set to True.
Focus Always Visible
Set to True or False, to control the focused style in the Report Viewer.
Page Horizontal Alignment
Lets you set the horizontal alignment and view for the report page. By default, when you preview the report in the Viewer, it is centrally aligned.
The following image shows the preview of a report with the horizontal alignment set to left.
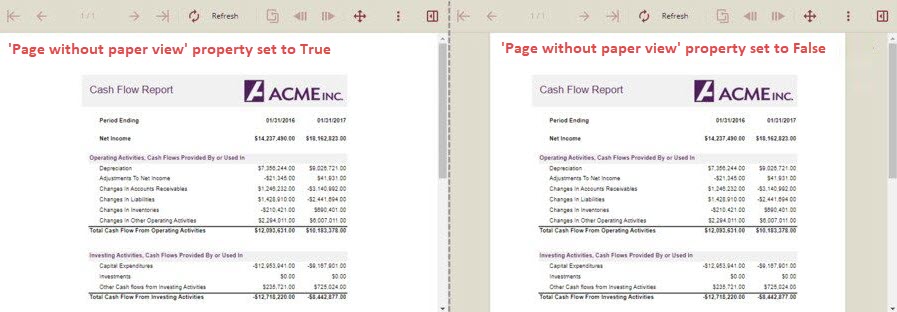
Page without Paper View
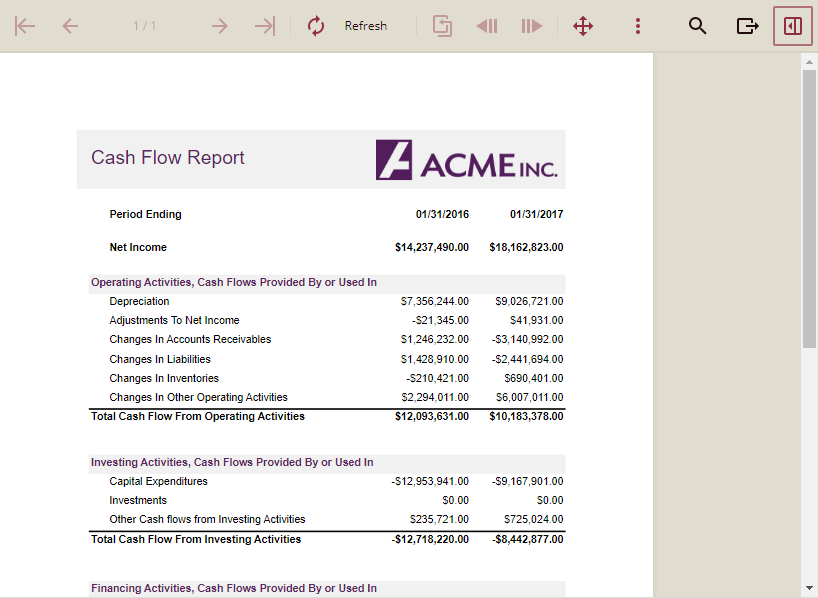
Allows you to choose whether the rendered report should appear as a page or a web page element.
If you set this property to True, the report is displayed as an element of a web page.
If you set this property to False, the report is displayed as a page.
The below image shows the difference between reports with and without the paper view. The shadow and the gray area around the report are invisible in case you render the report without a paper view.
Animation
Load Chart Animation
Set the option to True or False to control the animation effect when a chart is initially loaded in the Report Viewer. The animation effect can also be seen when you forcibly reload a chart or refresh the data while previewing the report.
The following image illustrates the load animation effect on a column chart in the report.
You can also pass valid parameters to the URL to enable the load chart animation effect in reports at run time ignoring the admin settings. For more information, see the Using Integration URLs article.
Hover Chart Animation
Set the option to True or False to control the hover effect on charts on previewing a report. The hover effect highlights the components in a chart on mouse hover.
You can add a hover effect to make a chart more dynamic, and keep the viewers engaged in your reports. Have a look at the below image that shows the hover effect on a column chart.
You can also pass valid parameters to the URL to enable hover chart animation in reports at run time ignoring the admin settings. For more information, see the Using Integration URLs article.
Hover Table Animation
Set the option to True or False to control the hover effect on the table and tablix rows on previewing a report. The hover effect highlights the rows in a table or tablix on mouse hover.
Hover Table Background Color
Tt specifies the background color on the mouse hover over the table and tablix rows. Set the hover effect for the table background on previewing a report. The hover effect highlights the rows in a table on mouse hover.
Hover Table Text Color
It specifies the text color on mouse hover over the table and tablix rows. Set the hover effect for the table text on previewing a report. The hover effect highlights the text in a table on mouse hover. The text color on hovering the mouse on the table and tablix rows depend on the color selected from this property.
Have a look at the following image that shows the hover effect on a table. The background color and the text color on hovering the mouse on the table and tablix rows depend on the portal theme. You can pass valid parameters to the URL to specify the background color and text color at run time. For more information, see the Using Integration URLs article.
### Chart Tooltip
These are the properties of the Chart Tooltip which is visible on previewing the reports.
Enable Chart Tooltip
Set the option to True or False to control the visibility of the Chart Tooltip on previewing the reports. When this option is set to True, then the following options are also enabled to customize the chart tooltip as per your requirement.
Chart Tooltip Background Color
Chart Tooltip Text Color
Chart Tooltip Font Family
Chart Tooltip Font Size
Chart Tooltip Font Weight
Chart Tooltip Border Color
Chart Tooltip Border Style
Chart Tooltip Border Radius
Hyperlink
These are the properties of the Hyperlinks which are visible on previewing the reports.
Set the following properties of Hyperlinks from this section as per the requirement.
Link Text Color: This is the text color of the hyperlink.
Visited Link Text Color: This is the color of the visited hyperlink.
Hovered Link Text Color: This is the color of the hyperlink which is hovered over with the mouse.