Designer
The designer settings in the Admin Portal allow you to modify the default behavior of the Wyn dashboard designer. These settings include controlling the visibility of the visualization wizard for a new dashboard, the component categories, the Inspector or Component panel when opening a dashboard, the Dashboard Explorer option, the mobile designer button, and the help and support icon in the designer.
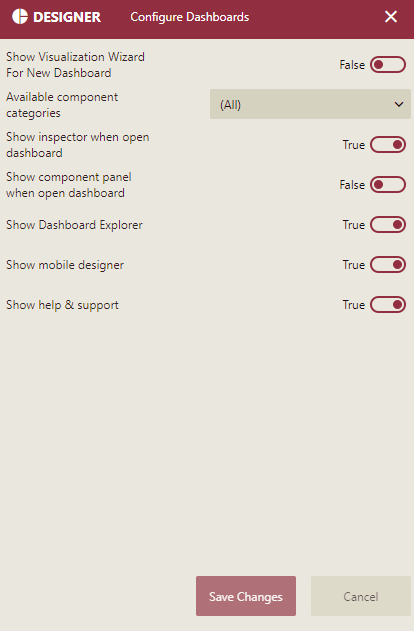
Show the Visualization Wizard for New Dashboard
Determines whether to display the Visualization Wizard window automatically when creating a new dashboard. By default, this option is set to 'False'. For more information, please visit the Visualization Wizard article.
Available Component Categories
The Wyn dashboard designer has different categories into which the Component panel is divided.
Category Name | Category Description |
|---|---|
Data Visualization | Contains built-in scenarios such as charts, tables, and maps. For more information, visit this article. |
Custom Visualization | Contains user-defined scenarios. For more information, visit this article. |
Components | Contains components such as containers, tab containers, rich text, and images, to help organize the data in dashboards. For more information, visit this article. |
Slicers | Contains label slicer, multi-dimensional slicer, multi-dimensional dropdown slicer, data range slicer, date range slicer, and relative dates slicer, which are used to filter the data dynamically. For more information visit this article. |
Component Template | Contains a list of component templates that can be reused in the current dashboard. The template retains all the settings of the component saved as a template such as title, appearance, data binding, and others. For more information, visit this article. |
Visualization Wizard | Generates smart scenarios for better data visualization. This is extremely beneficial for new users without prior knowledge of the BI tools. For more information, please visit this article. |
With the help of this setting, you can choose which categories should be shown to the end users. This way, you can restrict the users to work with certain categories.
For example, a user with the admin role does not want its end-users to reuse the wizards (scenarios, containers, and grouped components) of other dashboards in their current dashboard. In that case, the admin role can use the Available Component Categories setting and uncheck the Visual Gallery option from the list. By default, this setting is set to 'All'.
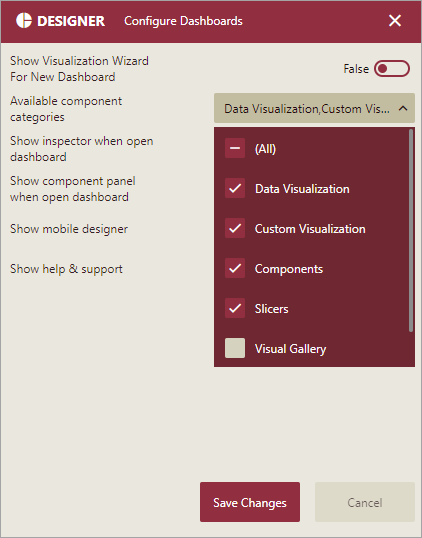
This is how the dashboard designer will look after applying the setting.
Note: Typically users cannot work with the scenarios belonging to a hidden component category, however, if an existing dashboard contains such a scenario, they can use the scenario.
Show Inspector Panel when Open Dashboard
Controls the default state (expand or collapse) of the Inspector panel when you open the dashboard designer. By setting this property to 'False', it will let you hide the Inspector panel from the end-users when they initially open or create a dashboard. However, this panel will appear automatically as soon as a scenario is dropped into the design area. By default, this property is set to 'True'.
Show Component Panel when Open Dashboard
Controls the default state (expand or collapse) of the Component panel when you open the dashboard designer. The Component panel consists of scenarios, components, slicers, reusable widgets, and smart scenarios necessary for creating and designing dashboards.
By default, this property is set to 'False'. It means the Component panel is collapsed when the end-user opens or creates a dashboard. In this way, the design area also widens horizontally, giving users more space for dashboard designing. To make the Component panel appear expanded, set this property to 'True'.
Note: When you pin the Component panel, the content in the design area gets shifted to the right side of the designer.
Show Dashboard Explorer
Controls the visibility of the Explorer option in the dashboard designer. The default value for this property is True. By setting this property to False, it will hide the Explorer option when you initially open or create a dashboard.
Show Mobile Designer Option
Controls the visibility of the Mobile Designer option in the Page Setup Bar of the dashboard designer. The default value for this property is 'True'.
Show Help & Support Option
Controls the default state (show or hide) of the Help and Support option that appears on the top-right corner of the dashboard designer. On clicking this option, an About Wyn Dashboards dialog box appears that shows the version details of the Wyn dashboard plugin. The default value for this property is 'True'.